Emergent constraint on snow-albedo effect#
Overview#
The recipe recipe_snowalbedo.yml computes the springtime snow-albedo feedback values in climate change versus springtime values in the seasonal cycle in transient climate change experiments following Hall and Qu (2006). The strength of the snow-albedo effect is quantified by the variation in net incoming shortwave radiation (Q) with surface air temperature (Ts) due to changes in surface albedo \(\alpha_s\):
The diagnostic produces scatterplots of simulated springtime \(\Delta \alpha_s\)/\(\Delta T_s\) values in climate change (ordinate) vs. simulated springtime \(\Delta \alpha_s\)/\(\Delta T_s\) values in the seasonal cycle (abscissa).
Ordinate values: the change in April \(\alpha_s\) (future projection - historical) averaged over NH land masses poleward of 30°N is divided by the change in April Ts (future projection - historical) averaged over the same region. The change in \(\alpha_s\) (or Ts) is defined as the difference between 22nd-century-mean \(\alpha_s\): (Ts) and 20th-century-mean \(\alpha_s\). Values of \(\alpha_s\) are weighted by April incoming insolation (It) prior to averaging.
Abscissa values: the seasonal cycle \(\Delta \alpha_s\)/\(\Delta T_s\) values, based on 20th century climatological means, are calculated by dividing the difference between April and May \(\alpha_s\): averaged over NH continents poleward of 30°N by the difference between April and May Ts averaged over the same area. Values of \(\alpha_s\): are weighted by April incoming insolation prior to averaging.
Available recipes and diagnostics#
Recipes are stored in recipes/
recipe_snowalbedo.yml
Diagnostics are stored in diag_scripts/emergent_constraints/
snowalbedo.ncl: springtime snow-albedo feedback values vs. seasonal cycle
User settings in recipe#
Script snowalbedo.ncl
Required settings for script
exp_presentday: name of present-day experiment (e.g. “historical”)
exp_future: name of climate change experiment (e.g. “rcp45”)
Optional settings for script
diagminmax: observational uncertainty (min and max)
legend_outside: create extra file with legend (true, false)
styleset: e.g. “CMIP5” (if not set, this diagnostic will create its own color table and symbols for plotting)
suffix: string to be added to output filenames
xmax: upper limit of x-axis (default = automatic)
xmin: lower limit of x-axis (default = automatic)
ymax: upper limit of y-axis (default = automatic)
ymin: lower limit of y-axis (default = automatic)
Required settings for variables
ref_model: name of reference data set
Optional settings for variables
none
Required settings (scripts)
none
Optional settings (scripts)
Variables#
tas (atmos, monthly mean, longitude latitude time)
rsdt (atmos, monthly mean, longitude latitude time)
rsuscs, rsdscs (atmos, monthly mean, longitude latitude time)
Observations and reformat scripts#
ERA-Interim (tas - esmvaltool/cmorizers/data/formatters/datasets/era_interim.py)
ISCCP-FH (rsuscs, rsdscs, rsdt - esmvaltool/cmorizers/data/formatters/datasets/isccp_fh.ncl)
References#
Flato, G., J. Marotzke, B. Abiodun, P. Braconnot, S.C. Chou, W. Collins, P. Cox, F. Driouech, S. Emori, V. Eyring, C. Forest, P. Gleckler, E. Guilyardi, C. Jakob, V. Kattsov, C. Reason and M. Rummukainen, 2013: Evaluation of Climate Models. In: Climate Change 2013: The Physical Science Basis. Contribution of Working Group I to the Fifth Assessment Report of the Intergovernmental Panel on Climate Change [Stocker, T.F., D. Qin, G.-K. Plattner, M. Tignor, S.K. Allen, J. Boschung, A. Nauels, Y. Xia, V. Bex and P.M. Midgley (eds.)]. Cambridge University Press, Cambridge, United Kingdom and New York, NY, USA.
Hall, A., and X. Qu, 2006: Using the current seasonal cycle to constrain snow albedo feedback in future climate change, Geophys. Res. Lett., 33, L03502, doi:10.1029/2005GL025127.
Example plots#
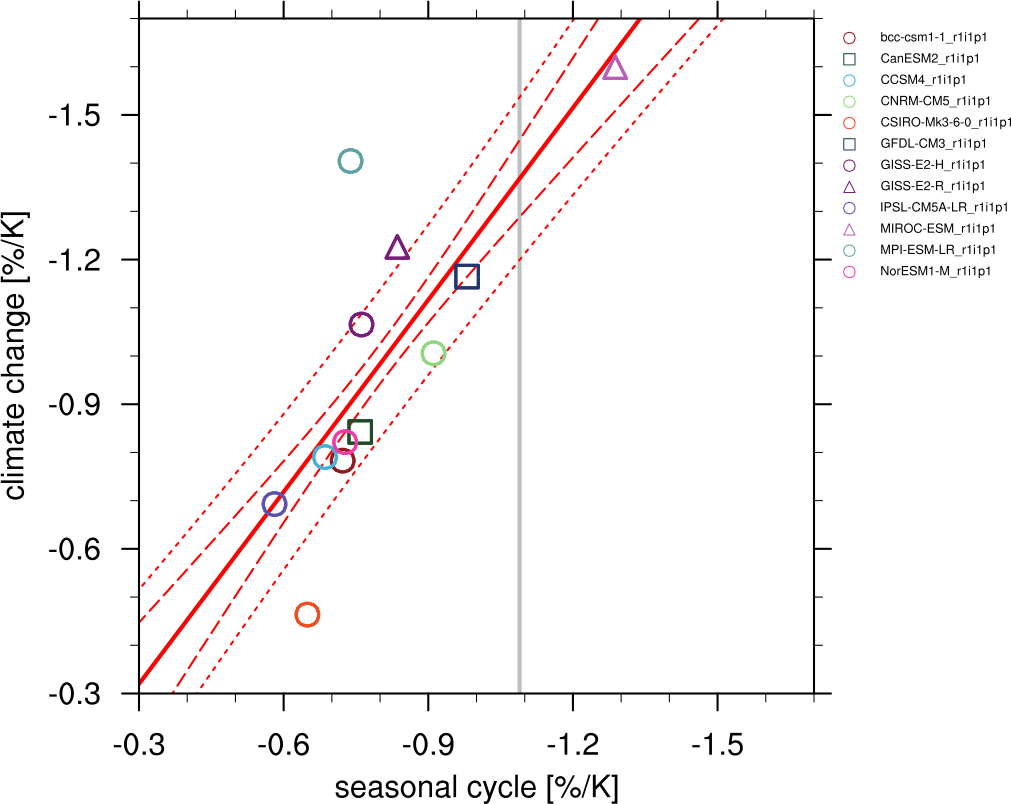
Fig. 258 Scatterplot of springtime snow-albedo effect values in climate change vs. springtime \(\Delta \alpha_s\)/\(\Delta T_s\) values in the seasonal cycle in transient climate change experiments (CMIP5 historical experiments: 1901-2000, RCP4.5 experiments: 2101-2200). Similar to IPCC AR5 Chapter 9 (Flato et al., 2013), Figure 9.45a.#