Sea Surface Salinity Evaluation#
Overview#
This recipe compares the regional means of sea surface salinity with a reference dataset (ESACCI-SEA-SURFACE-SALINITY v1 or v2 by default). To do this, the recipe generates plots for the timeseries of each region and a radar plot showing (i) the mean state bias, and (ii) the ratio between the simulated and observed standard deviations of different regional averages of sea surface salinity, calculated in the temporal window for which observations and simulations overlap.
Preprocessor requirements:#
The recipe is created in a way that should make possible (although is not tested) to use it for other variables and datasets, even for more than one at a time. The diagnostic only expects variables with dimensions time and depth_id and it does not assume any other constraint.
It is therefore mandatory to keep the extract_shape preprocessor for more than one region and any form of region operation (mean, max, min …) to collapse the latitude and longitude coordinates. In case you want to try with variables that have extra dimensions (i.e. depth) you must add an extra preprocessor call to collapse them (i.e. depth_integration)
The recipe can be used with any shapefile. As it is, it uses the IHO Sea Areas (version 3) downloaded from https://marineregions.org/downloads.php, but any shapefile containing marine regions can be used.
Any number of regions can be choosed also, even though plots may look odd if too few or too many are selected.
Regions available on IHO Sea Areas file:#
Adriatic Sea
Aegean Sea
Alboran Sea
Andaman or Burma Sea
Arabian Sea
Arafura Sea
Arctic Ocean
Baffin Bay
Balearic (Iberian Sea)
Bali Sea
Baltic Sea
Banda Sea
Barentsz Sea
Bass Strait
Bay of Bengal
Bay of Biscay
Bay of Fundy
Beaufort Sea
Bering Sea
Bismarck Sea
Black Sea
Bristol Channel
Caribbean Sea
Celebes Sea
Celtic Sea
Ceram Sea
Chukchi Sea
Coral Sea
Davis Strait
East Siberian Sea
Eastern China Sea
English Channel
Flores Sea
Great Australian Bight
Greenland Sea
Gulf of Aden
Gulf of Alaska
Gulf of Aqaba
Gulf of Boni
Gulf of Bothnia
Gulf of California
Gulf of Finland
Gulf of Guinea
Gulf of Mexico
Gulf of Oman
Gulf of Riga
Gulf of St. Lawrence
Gulf of Suez
Gulf of Thailand
Gulf of Tomini
Halmahera Sea
Hudson Bay
Hudson Strait
Indian Ocean
Inner Seas off the West Coast of Scotland
Ionian Sea
Irish Sea and St. George’s Channel
Japan Sea
Java Sea
Kara Sea
Kattegat
Labrador Sea
Laccadive Sea
Laptev Sea
Ligurian Sea
Lincoln Sea
Makassar Strait
Malacca Strait
Mediterranean Sea - Eastern Basin
Mediterranean Sea - Western Basin
Molukka Sea
Mozambique Channel
North Atlantic Ocean
North Pacific Ocean
North Sea
Norwegian Sea
Persian Gulf
Philippine Sea
Red Sea
Rio de La Plata
Savu Sea
Sea of Azov
Sea of Marmara
Sea of Okhotsk
Seto Naikai or Inland Sea
Singapore Strait
Skagerrak
Solomon Sea
South Atlantic Ocean
South China Sea
South Pacific Ocean
Southern Ocean
Strait of Gibraltar
Sulu Sea
Tasman Sea
The Coastal Waters of Southeast Alaska and British Columbia
The Northwestern Passages
Timor Sea
Tyrrhenian Sea
White Sea
Yellow Sea
Available recipes and diagnostics#
Recipes are stored in recipes/
recipe_sea_surface_salinity.yml
Diagnostics are stored in diag_scripts/sea_surface_salinity/
compare_salinity.py: plot timeseries for each region and generate radar plot.
User settings in recipe#
compare_salinity.py
Required settings for script
none
Optional settings for script
none
Required settings for variables
ref_model: name of reference data set
Optional settings for variables
none
Variables#
sos (ocean, monthly, time latitude longitude)
Observations and reformat scripts#
ESACCI-SEA-SURFACE-SALINITY (sos)
References#
Diagnostic: please contact authors
ESACCI-SEA-SURFACE-SALINITY dataset: Boutin, J., J.-L. Vergely, J. Koehler, F. Rouffi, N. Reul: ESA Sea Surface Salinity Climate Change Initiative (Sea_Surface_Salinity_cci): Version 1.8 data collection. Centre for Environmental Data Analysis, 25 November 2019. doi: 10.5285/9ef0ebf847564c2eabe62cac4899ec41. http://dx.doi.org/10.5285/9ef0ebf847564c2eabe62cac4899ec41
Example plots#
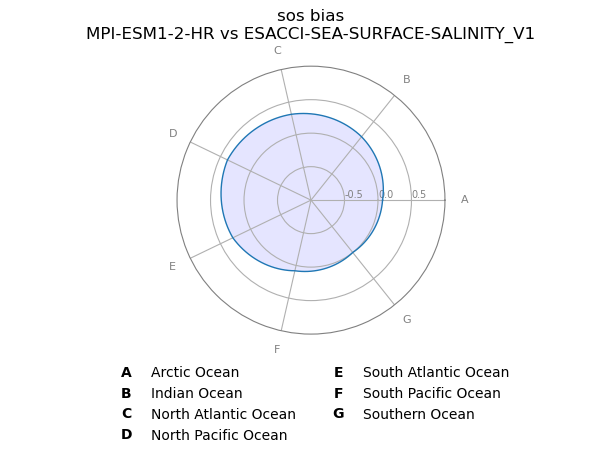
Fig. 365 Radar plot showing the mean state biases (simulation minus observations) for the regional averages of sea surface salinity in the selected ocean basins and seas.#
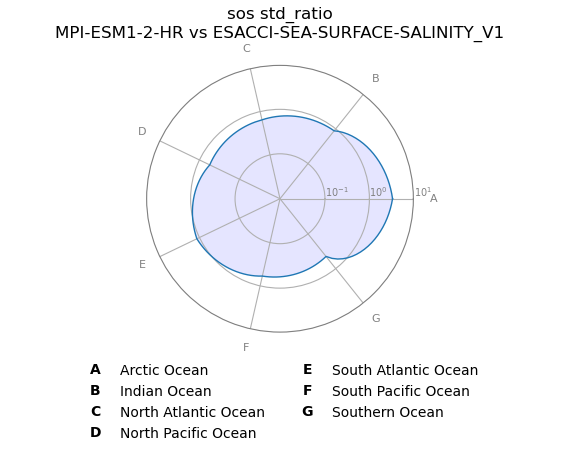
Fig. 366 Radar plot showing the ratio between the simulated and observed standard deviations of the regional averages of sea surface salinity in the selected ocean basins and seas.#