Diurnal temperature range#
Overview#
The goal of this diagnostic is to compute a vulnerability indicator for the diurnal temperature range (DTR); the maximum variation in temperature within a period of 24 hours at a given location. This indicator was first proposed by the energy sector, to identify locations which may experience increased diurnal temperature variation in the future, which would put additional stress on the operational management of district heating systems. This indicator was defined as the DTR exceeding 5 degrees celsius at a given location and day of the year (Deandreis et al., N.D.). Projections of this indicator currently present high uncertainties, uncertainties associated to both Tmax and Tmin in future climate projections.
As well as being of use to the energy sector, the global‐average DTR has been evaluated using both observations and climate model simulations (Braganza et. al., 2004) and changes in the mean and variability of the DTR have been shown to have a wide range of impacts on society, such as on the transmission of diseases (Lambrechts et al., 2011; Paaijmans et al., 2010).
The recipe recipe_diurnal_temperature_index.yml computes first a mean DTR for a reference period using historical simulations and then, the number of days when the DTR from the future climate projections exceeds that of the reference period by 5 degrees or more. The user can define both the reference and projection periods, and the region to be considered. The output produced by this recipe consists of a four panel plot showing the maps of the projected mean DTR indicator for each season and a netcdf file containing the corresponding data.
Available recipes and diagnostics#
Recipes are stored in recipes/
recipe_diurnal_temperature_index.yml
Diagnostics are stored in diag_scripts/magic_bsc/
diurnal_temp_index.R : calculates the diaurnal temperature vulnerability index.
User settings#
User setting files are stored in recipes/
recipe_diurnal_temperature_index.yml
Required settings for script
None
Variables#
tasmin and tasmax (atmos, daily, longitude, latitude, time)
Observations and reformat scripts#
None
References#
Amiri, S. (2013). Economic and Environmental Benefits of CHP-based District Heating Systems in Sweden. Retrieved from https://www.diva-portal.org/smash/get/diva2:622636/FULLTEXT01.pdf
Braganza, K., Karoly, D. J., & Arblaster, J. M. (2004). Diurnal temperature range as an index of global climate change during the twentieth century. Geophysical Research Letters, 31(13), n/a – n/a. https://doi.org/10.1029/2004GL019998
Déandreis, C. (IPSL), Braconnot, P. (IPSL), and Planton, S.(CNRMGAME)(2014). Impact du changement climatique sur la gestion des réseaux de chaleur. DALKIA, Étude réalisée pour l’entreprise DALKIA. Last access 24.02.2021. https://docplayer.fr/9496504-Impact-du-changement-climatique-sur-la-gestion-des-reseaux-de-chaleur.html
Lambrechts, L., Paaijmans, K. P., Fansiri, T., Carrington, L. B., Kramer, L. D., Thomas, M. B., & Scott, T. W. (2011). Impact of daily temperature fluctuations on dengue virus transmission by Aedes aegypti. Proceedings of the National Academy of Sciences of the United States of America, 108(18), 7460–7465. https://doi.org/10.1073/pnas.1101377108
Paaijmans, K. P., Blanford, S., Bell, A. S., Blanford, J. I., Read, A. F., & Thomas, M. B. (2010). Influence of climate on malaria transmission depends on daily temperature variation. Proceedings of the National Academy of Sciences of the United States of America, 107(34), 15135–15139. https://doi.org/10.1073/pnas.1006422107
Kalnay, E., & Cai, M. (2003). Impact of urbanization and land-use change on climate. Nature, 423(6939), 528–531. https://doi.org/10.1038/nature01675
Thyholt, M., & Hestnes, A. G. (2008). Heat supply to low-energy buildings in district heating areas: Analyses of CO2 emissions and electricity supply security. Energy and Buildings, 40(2), 131–139. https://doi.org/10.1016/J.ENBUILD.2007.01.016
Example plots#
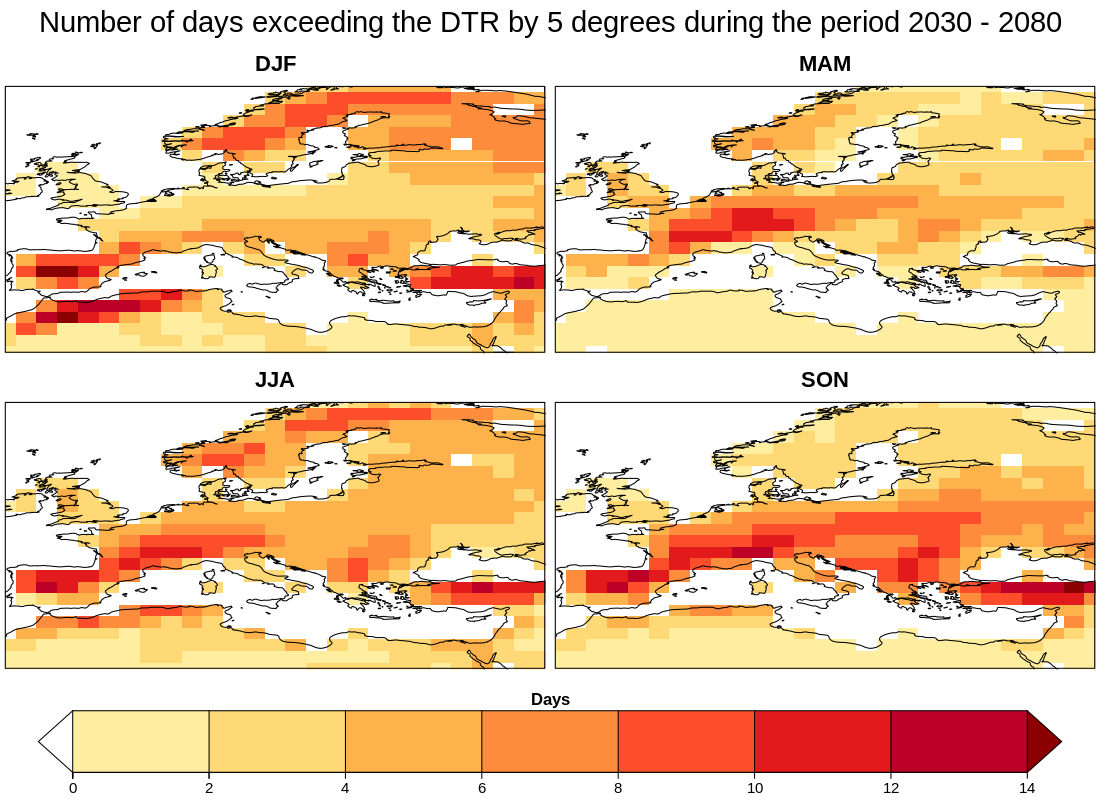
Fig. 157 Mean number of days exceeding the Diurnal Temperature Range (DTR) simulated during the historical period (1961-1990) by 5 degrees during the period 2030-2080. The result is derived from one RCP 8.5 scenario simulated by MPI-ESM-MR.#