Nino indices, North Atlantic Oscillation (NAO), Souther Oscillation Index (SOI)#
Overview#
The goal of this diagnostic is to compute indices based on area averages.
In recipe_combined_indices.yml, after defining the period (historical or future projection), the variable is selected. The predefined areas are:
Nino 3
Nino 3.4
Nino 4
North Atlantic Oscillation (NAO)
Southern Oscillation Index (SOI)
Available recipes and diagnostics#
Recipes are stored in recipes/
recipe_combined_indices.yml
Diagnostics are stored in diag_scripts/magic_bsc/
combined_indices.R : calculates the area-weighted means and multi-model means, with or without weights
User settings#
User setting files are stored in recipes/
recipe_combined_indices.yml
Required settings for script
region: one of the following strings Nino3, Nino3.4, Nino4, NAO, SOI
running_mean: an integer specifying the length of the window (in months) to be used for computing the running mean.
moninf: an integer can be given to determine the first month of the seasonal mean to be computed (from 1 to 12, corresponding to January to December respectively).
monsup: an integer specifying the last month to be computed (from 1 to 12, corresponding to January to December respectively).
standardized: ‘true’ or ‘false’ to specify whether to compute the standarization of the variable.
Required settings for preprocessor (only for 3D variables)
extract_levels:
levels: [50000] # e.g. for 500 hPa level
scheme: nearest
Variables#
all variables (atmos/ocean, monthly, longitude, latitude, time)
Observations and reformat scripts#
None
References#
Trenberth, Kevin & National Center for Atmospheric Research Staff (Eds). Last modified 11 Jan 2019. “The Climate Data Guide: Nino SST Indices (Nino 1+2, 3, 3.4, 4; ONI and TNI).” Retrieved from https://climatedataguide.ucar.edu/climate-data/nino-sst-indices-nino-12-3-34-4-oni-and-tni.
Example plots#
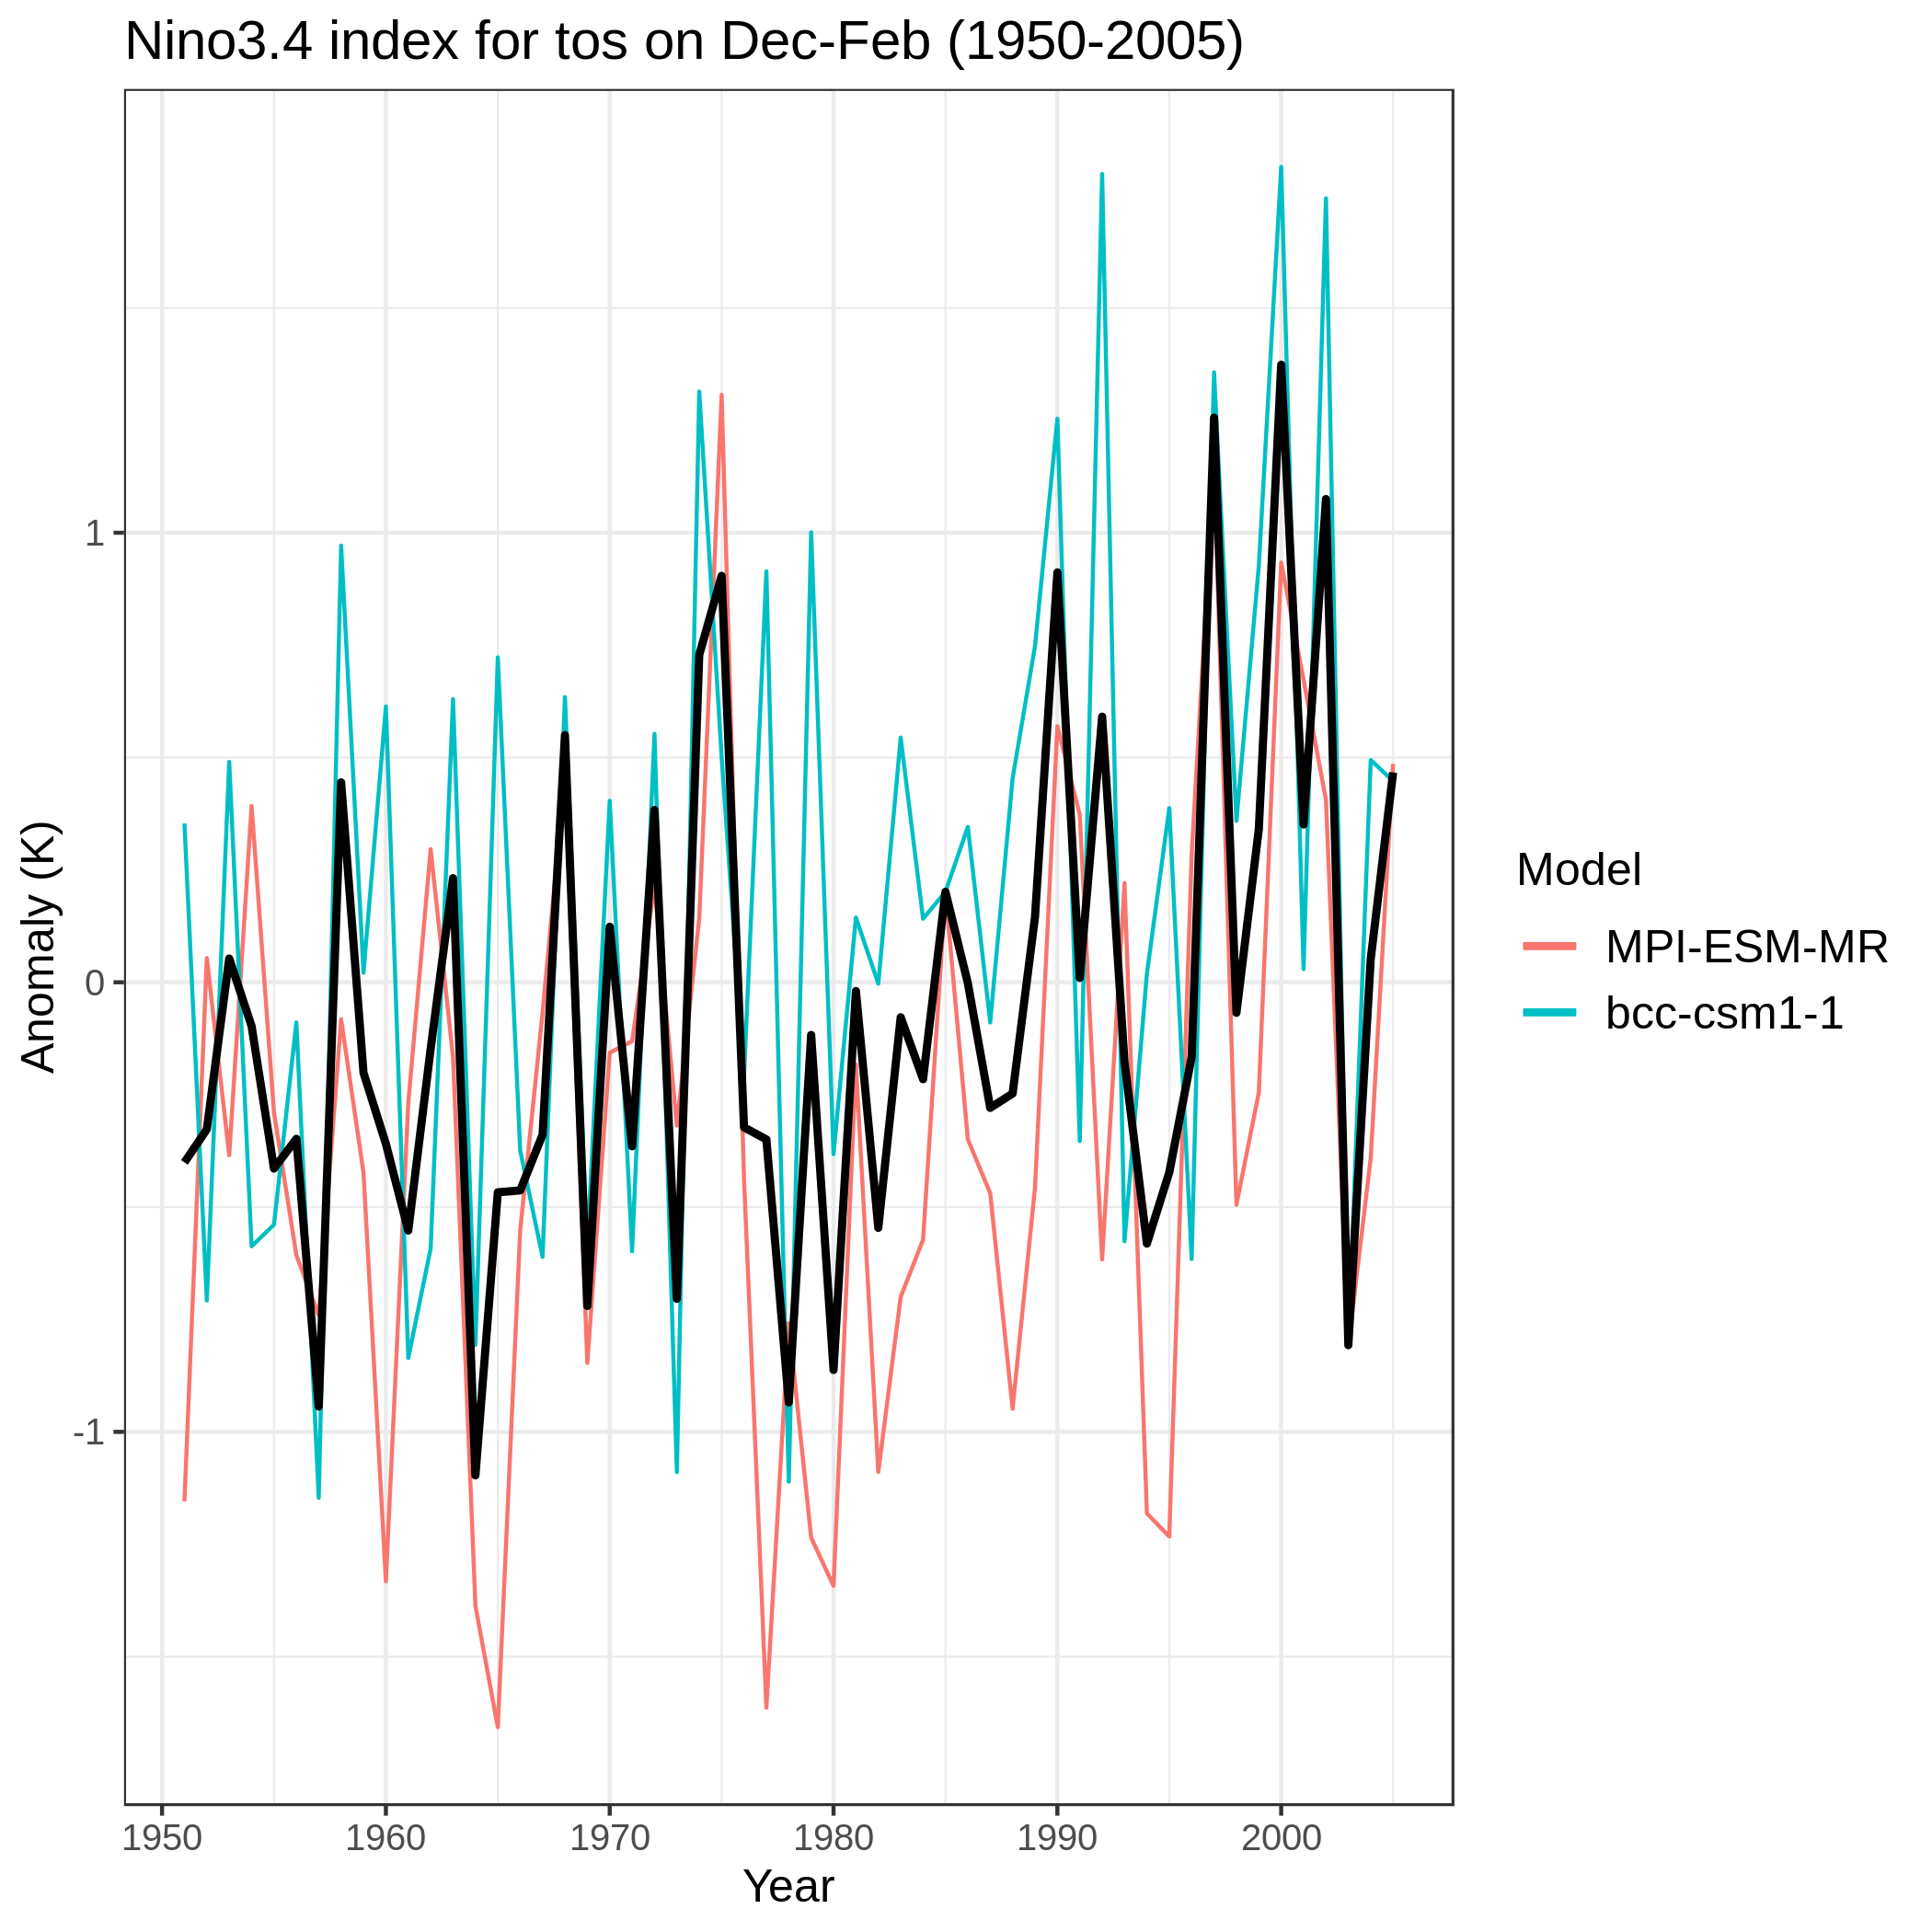
Fig. 351 Time series of the standardized sea surface temperature (tos) area averaged over the Nino 3.4 region during the boreal winter (December-January-February). The time series correspond to the MPI-ESM-MR (red) and BCC-CSM1-1 (blue) models and their mean (black) during the period 1950-2005 for the ensemble r1p1i1 of the historical simulations.#