Eady growth rate#
Overview#
This recipe computes the maximum Eady Growth Rate and performs the annual and seasonal means, storing the results for each dataset. For the seasonal means, the results are plotted over the North-Atlantic region for the selected pressure levels.
Available recipes and diagnostics#
Recipes are stored in esmvaltool/recipes/
recipe_eady_growth_rate.yml
Diagnostics are stored in esmvaltool/diag_scripts/eady_growth_rate/
eady_growth_rate.py: Computes and stores the eady growth rate. Plots can be produced for the seasonal mean over the North Atlantic region.
User settings in recipe#
Script
eady_growth_rate.pyRequired settings for script
time_statistic: Set to ‘annual’ to compute the annual mean. Set to ‘seasonal’ to compute the seasonal mean.
Optional settings for script
plot_levels: list of pressure levels to be plotted for the seasonal mean. If not specified, all levels will be plotted.
Variables#
ta (atmos, monthly mean, longitude latitude level time)
zg (atmos, monthly mean, longitude latitude level time)
ua (atmos, monthly mean, longitude latitude level time)
References#
Moreno-Chamarro, E., Caron, L-P., Ortega, P., Loosveldt Tomas, S., and Roberts, M. J., Can we trust CMIP5/6 future projections of European winter precipitation?. Environ. Res. Lett. 16 054063
Brian J Hoskins and Paul J Valdes. On the existence of storm-tracks. Journal of the atmospheric sciences, 47(15):1854–1864, 1990.
Example plots#
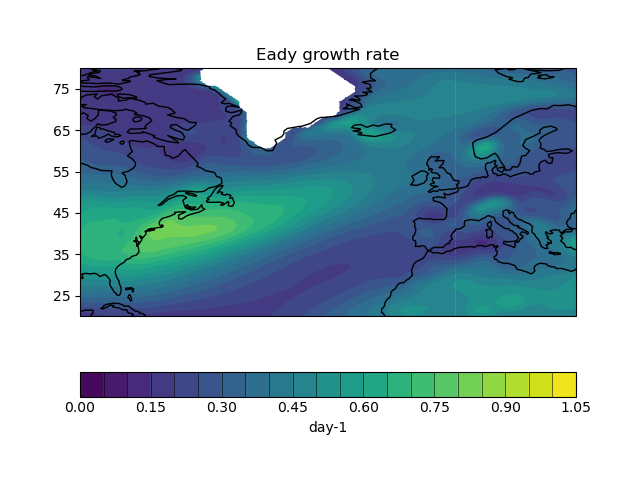
Fig. 163 Eady Growth Rate values over the North-Atlantic region at 70000 Pa.#