Context for interpreting equilibrium climate sensitivity and transient climate response from the CMIP6 Earth system models#
Overview#
This recipe reproduces the analysis of Meehl et al., Sci. Adv. (2020). In this paper, the equilibrium climate sensitivity (ECS) and transient climate response (TCR) are evaluated for the CMIP6 models and put into historical context.
Available recipes and diagnostics#
Recipes are stored in recipes/
recipe_meehl20sciadv.yml
Diagnostics are stored in diag_scripts/
climate_metrics/ecs.py
climate_metrics/tcr.py
climate_metrics/create_table.py
ipcc_ar5/ch09_fig09_42b.py
User settings in recipe#
Script climate_metrics/ecs.py
See here.
Script climate_metrics/tcr.py
See here.
Script climate_metrics/create_table.py
calculate_mean, bool, optional (default:True): Calculate mean over all datasets and add it to table.calculate_std, bool, optional (default:True): Calculate standard deviation over all datasets and add it to table.exclude_datasets, list of str, optional (default:['MultiModelMean']): Exclude certain datasets when calculating statistics over all datasets and for assigning an index.patterns, list of str, optional: Patterns to filter list of input data.round_output, int, optional: If given, round output to given number of decimals.
Script ipcc_ar5/ch09_fig09_42b.py
See here.
Variables#
rlut (atmos, monthly, longitude, latitude, time)
rsdt (atmos, monthly, longitude, latitude, time)
rsut (atmos, monthly, longitude, latitude, time)
tas (atmos, monthly, longitude, latitude, time)
References#
Meehl, G. A., Senior, C. A., Eyring, V., Flato, G., Lamarque, J. F., Stouffer, R. J., Taylor, K. E. and Schlund, M., Context for interpreting equilibrium climate sensitivity and transient climate response from the CMIP6 Earth system models, Science Advances, 6(26), eaba1981, https://doi.org/10.1126/sciadv.aba1981, 2020.
Example plots#
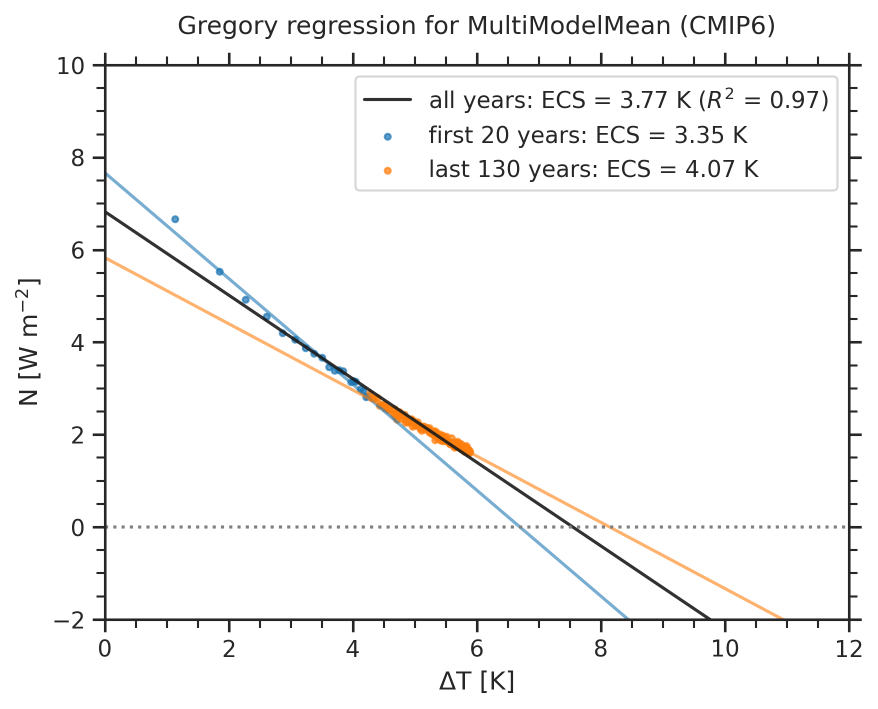
Fig. 244 ECS calculated for the CMIP6 models using the Gregory method over different time scales. Using the entire 150-year 4xCO2 experiment (black line), there is an ECS value of 3.8 K; using only the first 20 years (blue dots and blue line), there is an ECS of 3.4 K; and using the last 130 years, there is an ECS of 4.1 K (orange dots and orange line).#
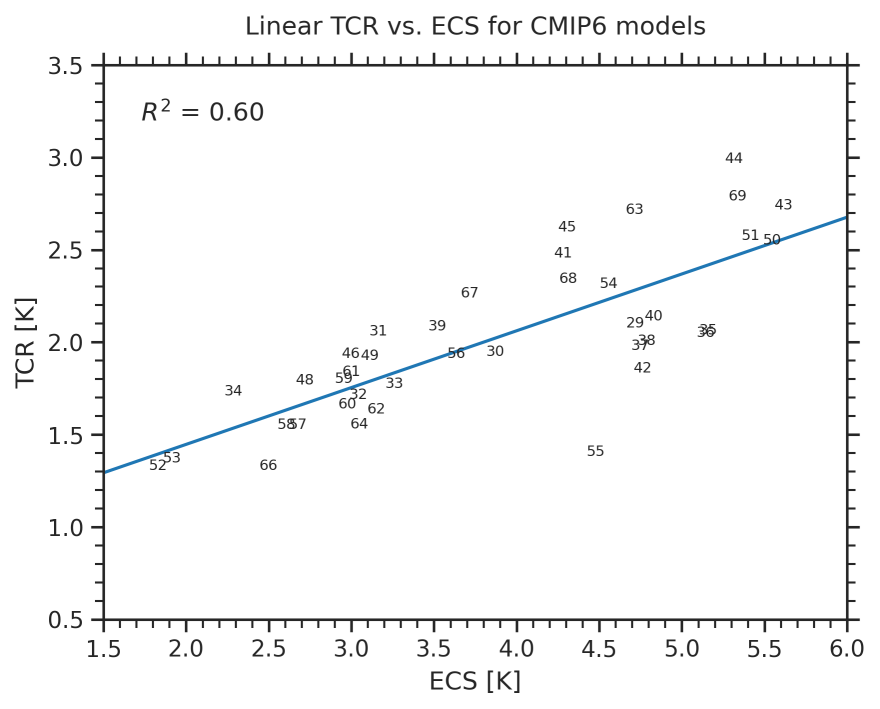
Fig. 245 TCR as a function of ECS for the CMIP6 models (black line is a linear fit). The \(R^2\) values are given in the upper left parts of each panel. The numbers denote individual CMIP6 models.#