Seaice feedback#
Overview#
In this recipe, one process-based diagnostic named the Ice Formation Efficiency (IFE) is computed based on monthly mean sea-ice volume estimated north of 80°N. The choice of this domain is motivated by the desire to minimize the influence of dynamic processes but also by the availability of sea-ice thickness measurements. The diagnostic intends to evaluate the strength of the negative sea-ice thickness/growth feedback, which causes late-summer negative anomalies in sea-ice area and volume to be partially recovered during the next growing season. A chief cause behind the existence of this feedback is the non-linear inverse dependence between heat conduction fluxes and sea-ice thickness, which implies that thin sea ice grows faster than thick sea ice. To estimate the strength of that feedback, anomalies of the annual minimum of sea-ice volume north of 80°N are first estimated. Then, the increase in sea-ice volume until the next annual maximum is computed for each year. The IFE is defined as the regression of this ice volume production onto the baseline summer volume anomaly.
Available recipes and diagnostics#
Recipes are stored in recipes/
recipe_seaice_feedback.yml
Diagnostics are stored in diag_scripts/seaice_feedback/
negative_seaice_feedback.py: scatterplot showing the feedback between seaice volume and seaice growth
User settings#
script negative_seaice_feedback.py
Optional settings for script
plot: dictionary containing plot options:
point_color: color of the plot points. (Default: black)
point_size: size of the plot points. (Default: 10)
show_values: show numerical values of feedback in plot. (Default: True)
Variables#
sit (seaice, monthly mean, time latitude longitude)
References#
Massonnet, F., Vancoppenolle, M., Goosse, H., Docquier, D., Fichefet, T. and Blanchard-Wrigglesworth, E., 2018. Arctic sea-ice change tied to its mean state through thermodynamic processes. Nature Climate Change, 8: 599-603.
Example plots#
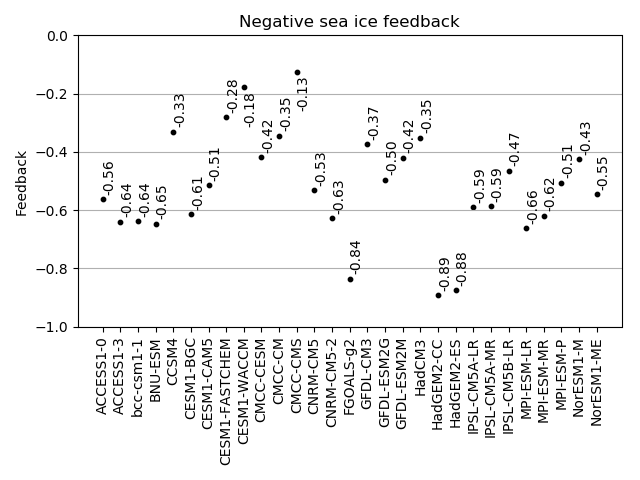
Fig. 399 Seaice negative feedback values (CMIP5 historical experiment 1979-2004).#