Seaborn Diagnostics#
Overview#
These recipes showcase the use of the Seaborn diagnostic that provides a high-level interface to Seaborn for ESMValTool recipes.
Available recipes and diagnostics#
Recipes are stored in recipes/
recipe_seaborn.yml
Diagnostics are stored in diag_scripts/
Variables#
Arbitrary variables are supported.
Observations and reformat scripts#
Arbitrary datasets are supported.
References#
Waskom, M. L. (2021), seaborn: statistical data visualization, Journal of Open Source Software, 6(60), 3021, doi:10.21105/joss.03021.
Example plots#
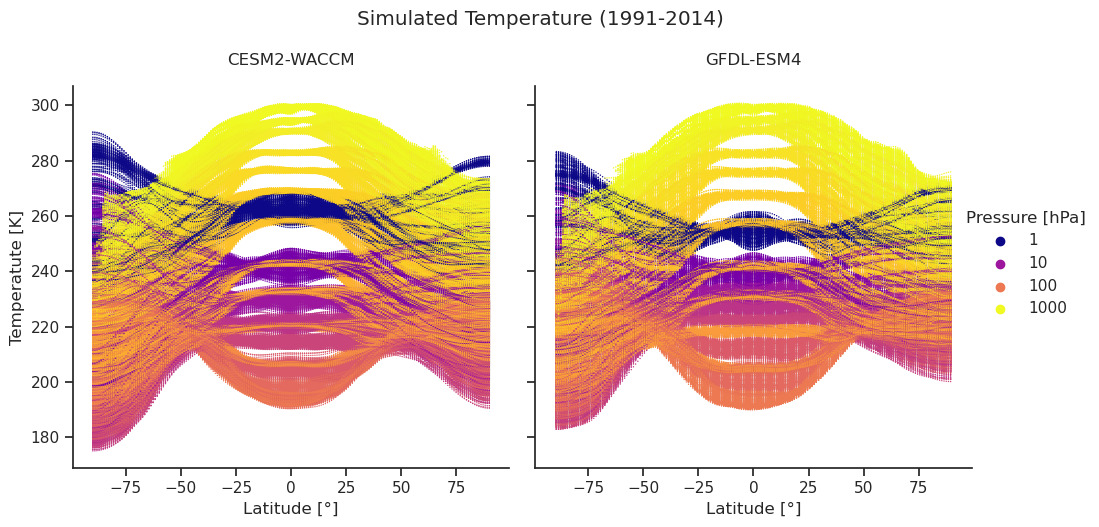
Fig. 125 Monthly and zonal mean temperatures vs. latitude in the period 1991-2014 for two Earth system models (CESM2-WACCM and GFDL-ESM4). Colors visualize the corresponding pressure levels.#
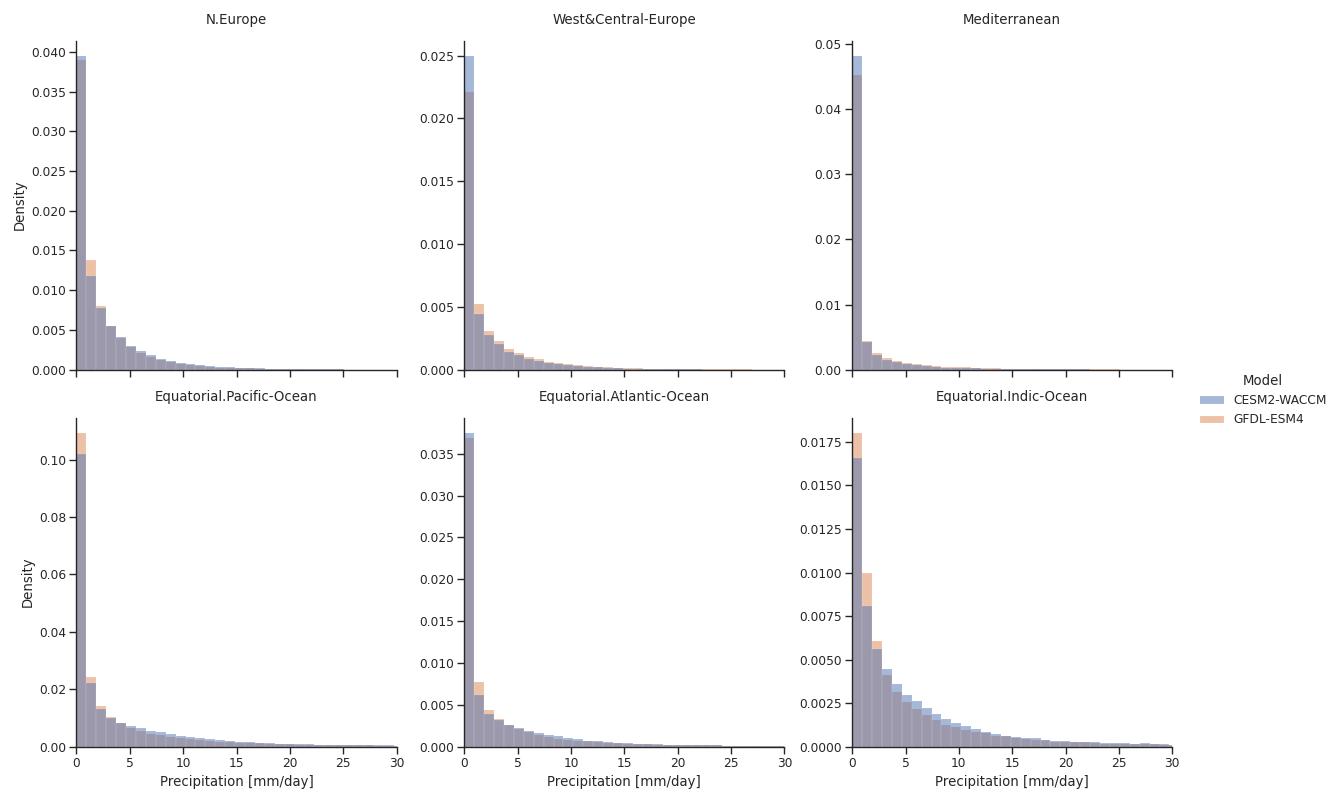
Fig. 126 Spatiotemporal distribution of daily precipitation in the period 2005-2014 for six IPCC AR6 regions simulated by two Earth system models (CESM2-WACCM and GFDL-ESM4). Each day in each grid cell in the corresponding regions is considered with equal weight.#