Precipitation quantile bias#
Overview#
Precipitation is a dominant component of the hydrological cycle, and as such a main driver of the climate system and human development. The reliability of climate projections and water resources strategies therefore depends on how well precipitation can be reproduced by the models used for simulations. While global circulation models from the CMIP5 project observations can reproduce the main patterns of mean precipitation, they often show shortages and biases in the ability to reproduce the strong precipitation tails of the distribution. Most models underestimate precipitation over arid regions and overestimate it over regions of complex topography, and these shortages are amplified at high quantile precipitation. The quantilebias recipe implements calculation of the quantile bias to allow evaluation of the precipitation bias based on a user defined quantile in models as compared to a reference dataset following Mehran et al. (2014). The quantile bias (QB) is defined as the ratio of monthly precipitation amounts in each simulation to that of the reference dataset (GPCP observations in the example) above a specified threshold t (e.g., the 75th percentile of all the local monthly values). A quantile bias equal to 1 indicates no bias in the simulations, whereas a value above (below) 1 corresponds to a climate model’s overestimation (underestimation) of the precipitation amount above the specified threshold t, with respect to that of the reference dataset.
Available recipes and diagnostics#
Recipes are stored in recipes/
recipe_quantilebias.yml
Diagnostics are stored in diag_scripts/quantilebias/
quantilebias.R
User settings#
Required settings for script
perc_lev: quantile (in %), e.g. 50
Variables#
pr (atmos, monthly, longitude latitude time)
Observations and reformat scripts#
GPCP-SG observations (accessible via the obs4MIPs project)
References#
Mehran, A. et al.: Journal of Geophysical Research: Atmospheres, Volume 119, Issue 4, pp. 1695-1707, 2014.
Example plots#
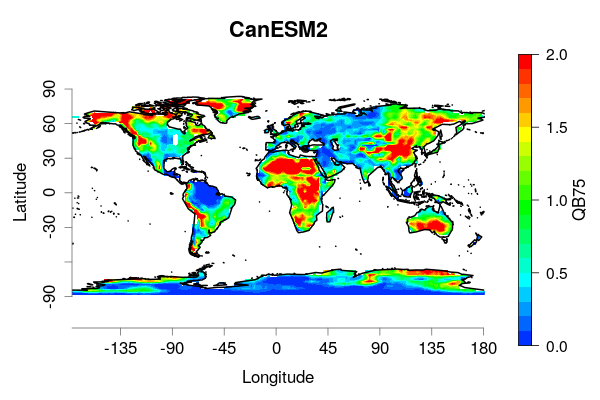
Fig. 188 Quantile bias, as defined in Mehran et al. 2014, with threshold t=75th percentile, evaluated for the CanESM2 model over the 1979-2005 period, adopting GPCP-SG v 2.3 gridded precipitation as a reference dataset. The optimal reference value is 1. Both datasets have been regridded onto a 2° regular grid.#