Stratosphere - Autoassess diagnostics#
Overview#
Polar night jet / easterly jet strengths are defined as the maximum / minimum wind speed of the climatological zonal mean jet, and measure how realistic the zonal wind climatology is in the stratosphere.
Extratropical temperature at 50hPa (area averaged poleward of 60 degrees) is important for polar stratospheric cloud formation (in winter/spring), determining the amount of heterogeneous ozone depletion simulated by models with interactive chemistry schemes.
The Quasi-Biennial Oscillation (QBO) is a good measure of tropical variability in the stratosphere. Zonal mean zonal wind at 30hPa is used to define the period and amplitude of the QBO.
The tropical tropopause cold point (100hPa, 10S-10N) temperature is an important factor in determining the stratospheric water vapour concentrations at entry point (70hPa, 10S-10N), and this in turn is important for the accurate simulation of stratospheric chemistry and radiative balance.
Performance metrics:
Polar night jet: northern hem (January) vs. ERA Interim
Polar night jet: southern hem (July) vs. ERA Interim
Easterly jet: southern hem (January) vs. ERA Interim
Easterly jet: northern hem (July) vs. ERA Interim
50 hPa temperature: 60N-90N (DJF) vs. ERA Interim
50 hPa temperature: 60N-90N (MAM) vs. ERA Interim
50 hPa temperature: 90S-60S (JJA) vs. ERA Interim
50 hPa temperature: 90S-60S (SON) vs. ERA Interim
QBO period at 30 hPa vs. ERA Interim
QBO amplitude at 30 hPa (westward) vs. ERA Interim
QBO amplitude at 30 hPa (eastward) vs. ERA Interim
100 hPa equatorial temp (annual mean) vs. ERA Interim
100 hPa equatorial temp (annual cycle strength) vs. ERA Interim
70 hPa 10S-10N water vapour (annual mean) vs. ERA-Interim
Diagnostic plot:
Age of stratospheric air vs. observations from Andrews et al. (2001) and Engel et al. (2009)
Available recipes and diagnostics#
Recipes are stored in esmvaltool/recipes/
recipe_autoassess_stratosphere.yml
Diagnostics are stored in esmvaltool/diag_scripts/autoassess/
autoassess_area_base.py: wrapper for autoassess scripts
stratosphere/strat_metrics_1.py: calculation of metrics
stratosphere/age_of_air.py: calculate age of stratospheric air
stratosphere/plotting.py: zonal mean wind and QBO plots
plot_autoassess_metrics.py: plot normalised assessment metrics
User settings in recipe#
The stratosphere area metric is part of the esmvaltool/diag_scripts/autoassess diagnostics,
and, as any other autoassess metric, it uses the autoassess_area_base.py as general purpose
wrapper. This wrapper accepts a number of input arguments that are read through from the recipe.
This recipe is part of the larger group of Autoassess metrics ported to ESMValTool
from the native Autoassess package from the UK’s Met Office. The diagnostics settings
are almost the same as for the other Atoassess metrics.
Note
Time gating for autoassess metrics.
To preserve the native Autoassess functionalities,
data loading and selection on time is done somewhat
differently for ESMValTool’s autoassess metrics: the
time selection is done in the preprocessor as per usual but
a further time selection is performed as part of the diagnostic.
For this purpose the user will specify a start: and end:
pair of arguments of scripts: autoassess_script (see below
for example). These are formatted as YYYY/MM/DD; this is
necessary since the Autoassess metrics are computed from 1-Dec
through 1-Dec rather than 1-Jan through 1-Jan. This is a temporary
implementation to fully replicate the native Autoassess functionality
and a minor user inconvenience since they need to set an extra set of
start and end arguments in the diagnostic; this will be phased
when all the native Autoassess metrics have been ported to ESMValTool
review has completed.
Note
Polar Night/Easterly Jets Metrics
Polar Night Jets (PNJ) metrics require data available at very low air pressures
ie very high altitudes; both Olar Night Jet and Easterly Jets computations should
be preformed using ta and ua data at << 100 Pa; the lowest air pressure
found in atmospheric CMOR mip tables corresponds to plev39 air pressure table,
and is used in the AERmonZ mip. If the user requires correct calculations of these
jets, it is highly advisable to use data from AERmonZ. Note that standard QBO
calculation is exact for plev17 or plev19 tables.
An example of standard inputs as read by autoassess_area_base.py and passed
over to the diagnostic/metric is listed below.
scripts:
  autoassess_strato_test_1: &autoassess_strato_test_1_settings
    script: autoassess/autoassess_area_base.py  # the base wrapper
    title: "Autoassess Stratosphere Diagnostic Metric"  # title
    area: stratosphere  # assesment area
    control_model: UKESM1-0-LL-hist  # control dataset name
    exp_model: UKESM1-0-LL-piCont  # experiment dataset name
    obs_models: [ERA-Interim]  # list to hold models that are NOT for metrics but for obs operations
    additional_metrics: [ERA-Interim]  # list to hold additional datasets for metrics
    start: 2004/12/01  # start date in native Autoassess format
    end: 2014/12/01  # end date in native Autoassess format
Variables#
Variable/Field name |
realm |
frequency |
Comment |
|---|---|---|---|
Eastward wind (ua) |
Atmosphere |
monthly mean |
original stash: x-wind, no stash |
Air temperature (ta) |
Atmosphere |
monthly mean |
original stash: m01s30i204 |
Specific humidity (hus) |
Atmosphere |
monthly mean |
original stash: m01s30i205 |
The recipe takes as input a control model and experimental model, comparisons being made with these two CMIP models; additionally it can take observational data s input, in the current implementation ERA-Interim.
Observations and reformat scripts#
ERA-Interim (ta, ua, hus - cmorizers/data/formatters/datasets/era_interim.py)
References#
Andrews, A. E., and Coauthors, 2001: Mean ages of stratospheric air derived from in situ observations of CO2, CH4, and N2O. J. Geophys. Res., 106 (D23), 32295-32314.
Dee, D. P., and Coauthors, 2011: The ERA-Interim reanalysis: configuration and performance of the data assimilation system. Q. J. R. Meteorol. Soc, 137, 553-597, doi:10.1002/qj.828.
Engel, A., and Coauthors, 2009: Age of stratospheric air unchanged within uncertainties over the past 30 years. Nat. Geosci., 2, 28-31, doi:10 .1038/NGEO388.
Example metrics and plots#
Below is a set of metrics for UKESM1-0-LL (historical data); the table shows a comparison made between running ESMValTool on CMIP6 CMORized netCDF data freely available on ESGF nodes and the run made using native Autoassess performed at the Met Office using the pp output of the model.
Metric name |
UKESM1-0-LL; CMIP6: AERmonZ; historical, ESGF |
UKESM1-0-LL; pp files; historical, u-bc179 |
|---|---|---|
Polar night jet: northern hem (January) |
44.86 |
44.91 |
Polar night jet: southern hem (July) |
112.09 |
112.05 |
Easterly jet: southern hem (January) |
76.12 |
75.85 |
Easterly jet: northern hem (July) |
55.68 |
55.74 |
QBO period at 30 hPa |
41.50 |
41.00 |
QBO amplitude at 30 hPa (westward) |
27.39 |
27.39 |
QBO amplitude at 30 hPa (eastward) |
17.36 |
17.36 |
50 hPa temperature: 60N-90N (DJF) |
27.11 |
26.85 |
50 hPa temperature: 60N-90N (MAM) |
40.94 |
40.92 |
50 hPa temperature: 90S-60S (JJA) |
11.75 |
11.30 |
50 hPa temperature: 90S-60S (SON) |
23.88 |
23.63 |
100 hPa equatorial temp (annual mean) |
15.29 |
15.30 |
100 hPa equatorial temp (annual cycle strength) |
1.67 |
1.67 |
100 hPa 10Sto10N temp (annual mean) |
15.48 |
15.46 |
100 hPa 10Sto10N temp (annual cycle strength) |
1.62 |
1.62 |
70 hPa 10Sto10N wv (annual mean) |
5.75 |
5.75 |
Results from u-bc179 have been obtained by running the native Autoassess/stratosphere
on .pp data from UKESM1 u-bc179 suite and are listed here to confirm the
compliance between the ported Autoassess metric in ESMValTool and the original native metric.
Another reference run comparing UKESM1-0-LL to the physical model HadGEM3-GC31-LL can be found here .
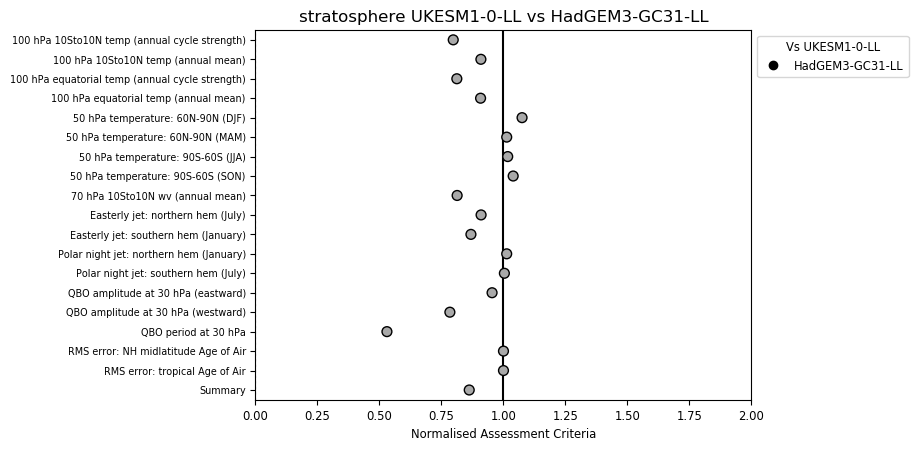
Fig. 194 Standard metrics plot comparing standard metrics from UKESM1-0-LL and HadGEM3-GC31.#
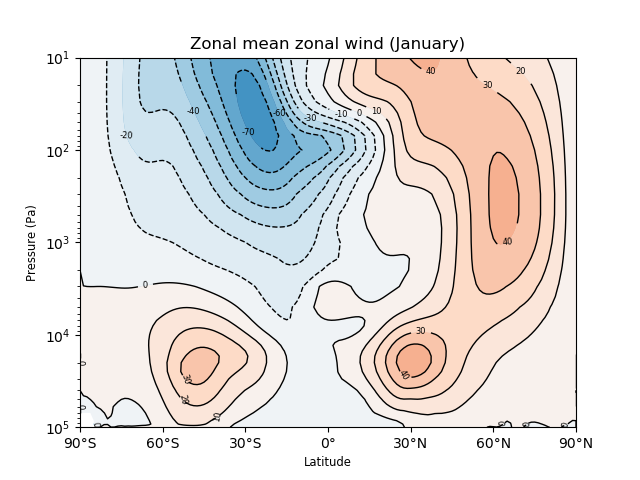
Fig. 195 Zonal mean zonal wind in January for UKESM1-0-LL.#
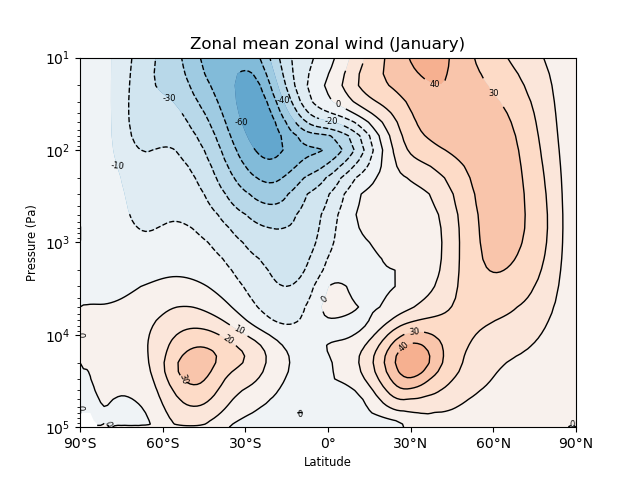
Fig. 196 Zonal mean zonal wind in January for HadGEM3-GC31-LL.#
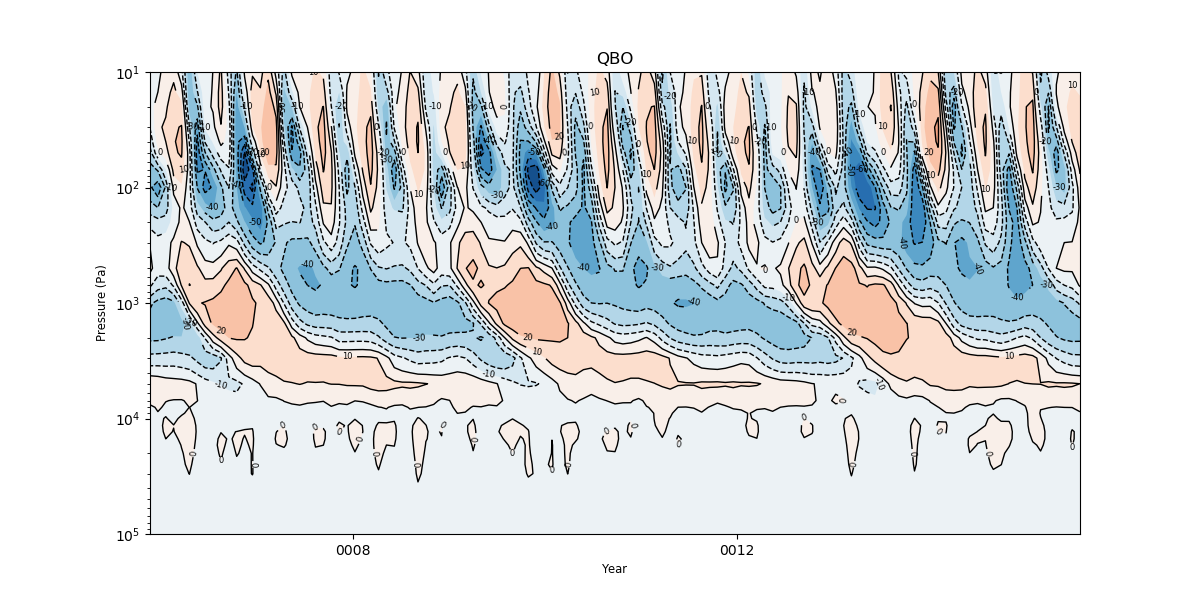
Fig. 197 QBO for UKESM1-0-LL.#
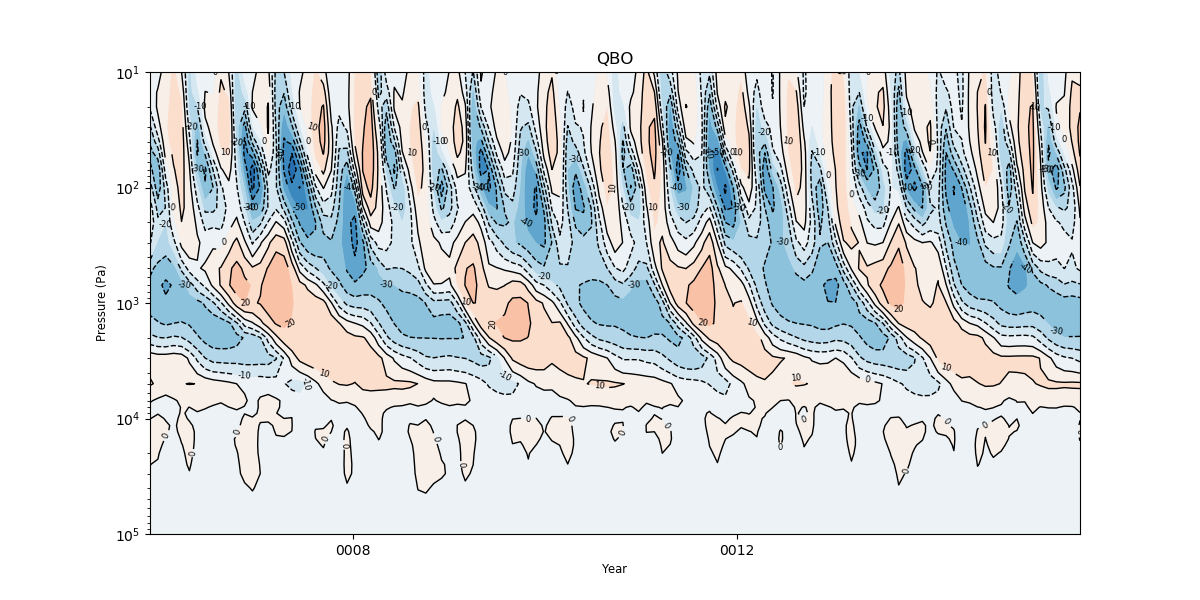
Fig. 198 QBO for HadGEM3-GC31-LL.#
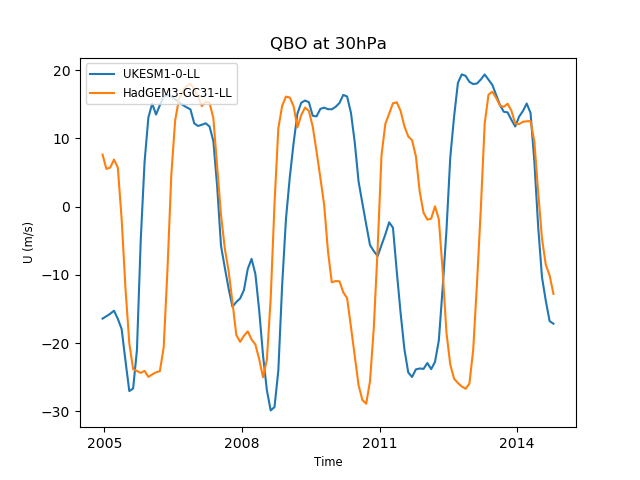
Fig. 199 QBO at 30hPa comparison between UKESM1-0-LL and HadGEM3-GC31-LL.#
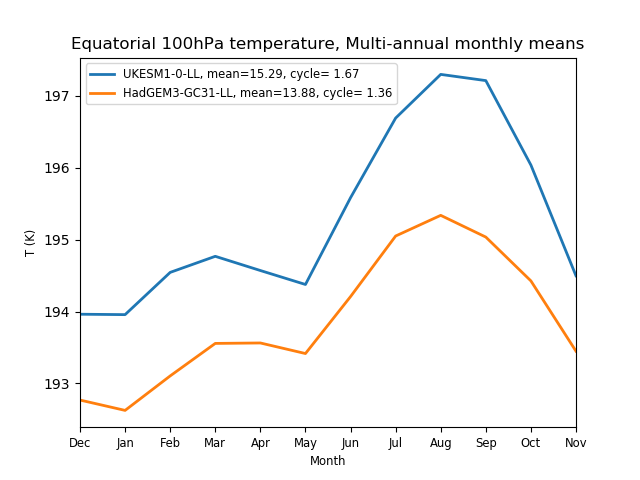
Fig. 200 Equatorial temperature at 100hPa, multi annual means.#
Prior and current contributors#
Met Office:
Prior to May 2008: Neal Butchart
May 2008 - May 2016: Steven C Hardiman
Since May 2016: Alistair Sellar and Paul Earnshaw
ESMValTool:
Since April 2018: Porting into ESMValTool by Valeriu Predoi
Developers#
Met Office:
Prior to May 2008: Neal Butchart
May 2008 - May 2016: Steven C Hardiman
ESMValTool:
Since April 2018: Valeriu Predoi