Combined Climate Extreme Index#
Overview#
The goal of this diagnostic is to compute time series of a number of extreme events: heatwave, coldwave, heavy precipitation, drought and high wind. Then, the user can combine these different components (with or without weights). The result is an index similar to the Climate Extremes Index (CEI; Karl et al., 1996), the modified CEI (mCEI; Gleason et al., 2008) or the Actuaries Climate Index (ACI; American Academy of Actuaries, 2018). The output consists of a netcdf file containing the area-weighted and multi-model multi-metric index. This recipe expects data of daily temporal resolution, and the running average is computed based on the user-defined window length (e.g. a window length of 5 would compute the 5-day running mean).
In recipe_extreme_index.yml, after defining the area and reference and projection period, the weigths for each metric selected. The options are
weight_t90p the weight of the number of days when the maximum temperature exceeds the 90th percentile,
weight_t10p the weight of the number of days when the minimum temperature falls below the 10th percentile,
weight_Wx the weight of the number of days when wind power (third power of wind speed) exceeds the 90th percentile,
weight_cdd the weight of the maximum length of a dry spell, defined as the maximum number of consecutive days when the daily precipitation is lower than 1 mm, and
weight_rx5day the weight of the maximum precipitation accumulated during 5 consecutive days.
Available recipes and diagnostics#
Recipes are stored in recipes/
recipe_extreme_index.yml
Diagnostics are stored in diag_scripts/magic_bsc/
extreme_index.R
User settings#
User setting files are stored in recipes/
recipe_extreme_index.yml
Required settings for script
weight_t90p: 0.2 (from 0 to 1, the total sum of the weight should be 1)
weight_t10p: 0.2 (from 0 to 1, the total sum of the weight should be 1)
weight_Wx: 0.2 (from 0 to 1, the total sum of the weight should be 1)
weight_rx5day: 0.2 (from 0 to 1, the total sum of the weight should be 1)
weight_cdd: 0.2 (from 0 to 1, the total sum of the weight should be 1)
running_mean: 5 (depends on the length of the future projection period selected, but recommended not greater than 11)
Variables#
tasmax (atmos, daily, longitude, latitude, time)
tasmin (atmos, daily, longitude, latitude, time)
sfcWind (atmos, daily, longitude, latitude, time)
pr (atmos, daily, longitude, latitude, time)
Observations and reformat scripts#
None
References#
Alexander L.V. and Coauthors (2006). Global observed changes in daily climate extremes of temperature and precipitation. J. Geophys. Res., 111, D05109. https://doi.org/10.1029/2005JD006290
American Academy of Actuaries, Canadian Institute of Actuaries, Casualty Actuarial Society and Society of Actuaries. Actuaries Climate Index. http://actuariesclimateindex.org (2018-10-06).
Donat, M., and Coauthors (2013). Updated analyses of temperature and precipitation extreme indices since the beginning of the twentieth century: The HadEX2 dataset. J. Geophys. Res., 118, 2098–2118, https://doi.org/10.1002/jgrd.50150.
Fouillet, A., Rey, G., Laurent, F., Pavillon, G. Bellec, S., Guihenneuc-Jouyaux, C., Clavel J., Jougla, E. and Hémon, D. (2006) Excess mortality related to the August 2003 heat wave in France. Int. Arch. Occup. Environ. Health, 80, 16–24. https://doi.org/10.1007/s00420-006-0089-4
Gleason, K.L., J.H. Lawrimore, D.H. Levinson, T.R. Karl, and D.J. Karoly (2008). A Revised U.S. Climate Extremes Index. J. Climate, 21, 2124-2137 https://doi.org/10.1175/2007JCLI1883.1
Meehl, G. A., and Coauthors (2000). An introduction to trends inextreme weather and climate events: Observations, socio-economic impacts, terrestrial ecological impacts, and model projections. Bull. Amer. Meteor. Soc., 81, 413–416. doi: 10.1175/1520-0477(2000)081<0413:AITTIE>2.3.CO;2
Whitman, S., G. Good, E. R. Donoghue, N. Benbow, W. Y. Shou and S. X. Mou (1997). Mortality in Chicago attributed to the July 1995 heat wave. Amer. J. Public Health, 87, 1515–1518. https://doi.org/10.2105/AJPH.87.9.1515
Zhang, Y., M. Nitschke, and P. Bi (2013). Risk factors for direct heat-related hospitalization during the 2009 Adelaide heat-wave: A case crossover study. Sci. Total Environ., 442, 1–5. https://doi.org/10.1016/j.scitotenv.2012.10.042
Zhang, X. , Alexander, L. , Hegerl, G. C., Jones, P. , Tank, A. K., Peterson, T. C., Trewin, B. and Zwiers, F. W. (2011). Indices for monitoring changes in extremes based on daily temperature and precipitation data. WIREs Clim Change, 2: 851-870. doi:10.1002/wcc.147. https://doi.org/10.1002/wcc.147
Example plots#
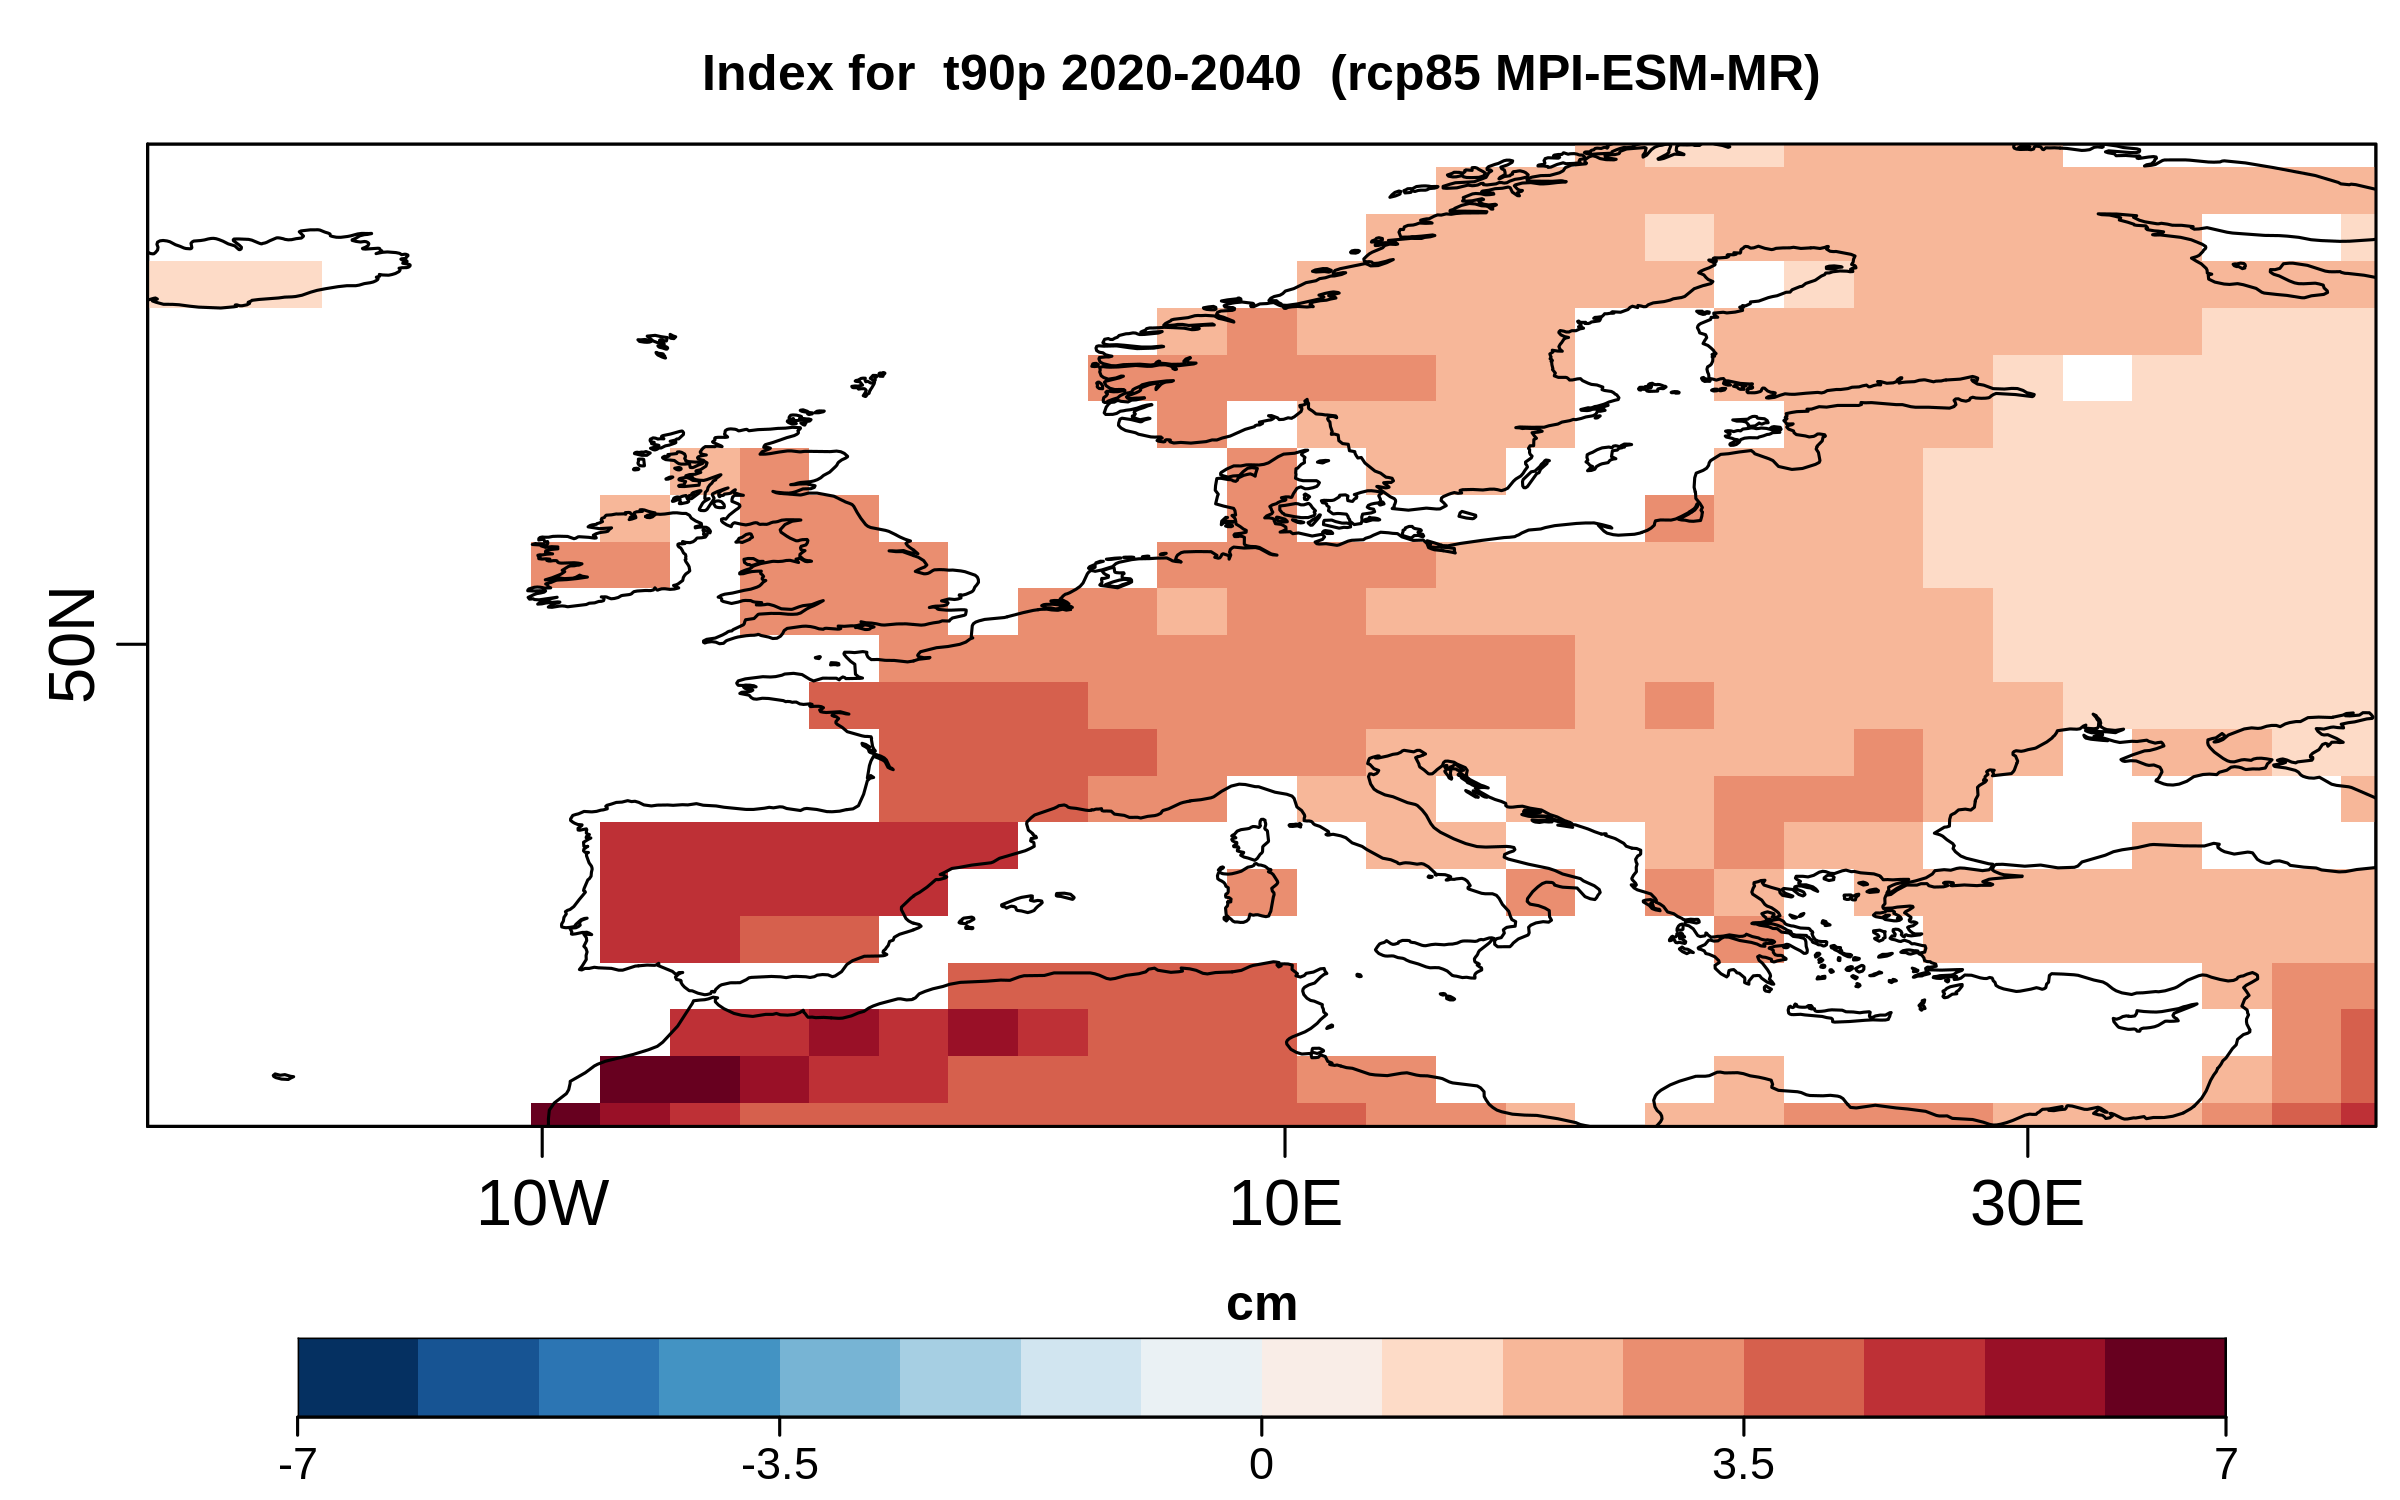
Fig. 166 Average change in the heat component (t90p metric) of the Combined Climate Extreme Index for the 2020-2040 compared to the 1971-2000 reference period for the RCP 8.5 scenario simulated by MPI-ESM-MR.#