Multi-model products#
Overview#
The goal of this diagnostic is to compute the multi-model ensemble mean for a set of models selected by the user for individual variables and different temporal resolutions (annual, seasonal, monthly).
After selecting the region (defined by the lowermost and uppermost longitudes and latitudes), the mean for the selected reference period is subtracted from the projections in order to obtain the anomalies for the desired period. In addition, the recipe computes the percentage of models agreeing on the sign of this anomaly, thus providing some indication on the robustness of the climate signal.
The output of the recipe consists of a colored map showing the time average of the multi-model mean anomaly and stippling to indicate locations where the percentage of models agreeing on the sign of the anomaly exceeds a threshold selected by the user. Furthermore, a time series of the area-weighted mean anomaly for the projections is plotted. For the plots, the user can select the length of the running window for temporal smoothing and choose to display the ensemble mean with a light shading to represent the spread of the ensemble or choose to display each individual models.
Available recipes and diagnostics#
Recipes are stored in recipes/
recipe_multimodel_products.yml
Diagnostics are stored in diag_scripts/magic_bsc/
multimodel_products.R - script for computing multimodel anomalies and their agreement.
User settings#
User setting files are stored in recipes/
recipe_multimodel_products.yml
Required settings for script
colorbar_lim: positive number specifying the range (-colorbar_lim … +colorbar_lim) of the colorbar (0 = automatic colorbar scaling)
moninf: integer specifying the first month of the seasonal mean period to be computed
monsup: integer specifying the last month of the seasonal mean period to be computed, if it’s null the anomaly of month indicated in moninf will be computed
agreement_threshold: integer between 0 and 100 indicating the threshold in percent for the minimum agreement between models on the sign of the multi-model mean anomaly for the stipling to be plotted
running_mean: integer indictating the length of the window for the running mean to be computed
time_series_plot: Either single or maxmin (plot the individual or the mean with shading between the max and min).
Variables#
any Amon variable (atmos, monthly mean, longitude latitude time)
Observations and reformat scripts#
None
References#
Hagedorn, R., Doblas-Reyes, F. J., Palmer, T. N., Nat E H Ag E D O R N, R. E., & Pa, T. N. (2005). The rationale behind the success of multi-model ensembles in seasonal forecasting-I. Basic concept, 57, 219–233. https://doi.org/10.3402/tellusa.v57i3.14657
Weigel, A. P., Liniger, M. A., & Appenzeller, C. (2008). Can multi-model combination really enhance the prediction skill of probabilistic ensemble forecasts? Quarterly Journal of the Royal Meteorological Society, 134(630), 241–260. https://doi.org/10.1002/qj.210
Example plots#
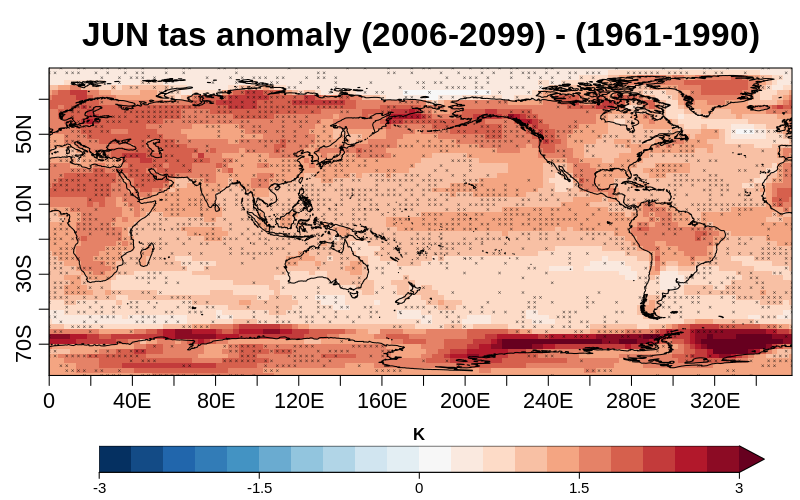
Fig. 392 Multi-model mean anomaly of 2-m air temperature during the future projection 2006-2099 in June considering the reference period 1961-1990 (colours). Crosses indicate that the 80% of models agree in the sign of the multi-model mean anomaly. The models selected are BCC-CSM1-1, MPI-ESM-MR and MIROC5 in the r1i1p1 ensembles for the RCP 2.6 scenario.#