Drought characteristics following Martin (2018)#
Overview#
Following Martin (2018) drought characteristics are calculated based on the standard precipitation index (SPI), see Mckee et al. (1993). These characteristics are frequency, average duration, SPI index and severity index of drought events.
Available recipes and diagnostics#
Recipes are stored in recipes/droughts/
recipe_martin18grl.yml
Diagnostics are stored in diag_scripts/droughts/
Functions for metric calculation, plots and utility can be found in
droughts/collect_drought_func.py.
User settings in recipe#
The recipe calculates SPI for two different time periods. The first part compares CMIP5 models with the CRU observational dataset. The second part compares the last 51 years of the 21st century with the historical period (1950-2000) for the RCP8.5 scenario.
The recipe can be run with different CMIP5 and CMIP6 models and one
observational or reanalysis data set. The latter is specified as
reference_dataset in the recipe.
The distribution (distribution: Gamma) and the representative time scale
(smooth_month: 6) can be changed by the user too. A complete list of
settings and their description can be found in the
SPEI recipe and
Collect drought API documentation.
Variables#
pr (atmos, monthly, longitude, latitude, time)
Observations and reformat scripts#
None
References#
Martin, E.R. (2018). Future Projections of Global Pluvial and Drought Event Characteristics. Geophysical Research Letters, 45, 11913-11920.
McKee, T. B., Doesken, N. J., & Kleist, J. (1993). The relationship of drought frequency and duration to time scales. In Proceedings of the 8th Conference on Applied Climatology (Vol. 17, No. 22, pp. 179-183). Boston, MA: American Meteorological Society.
Example plots#
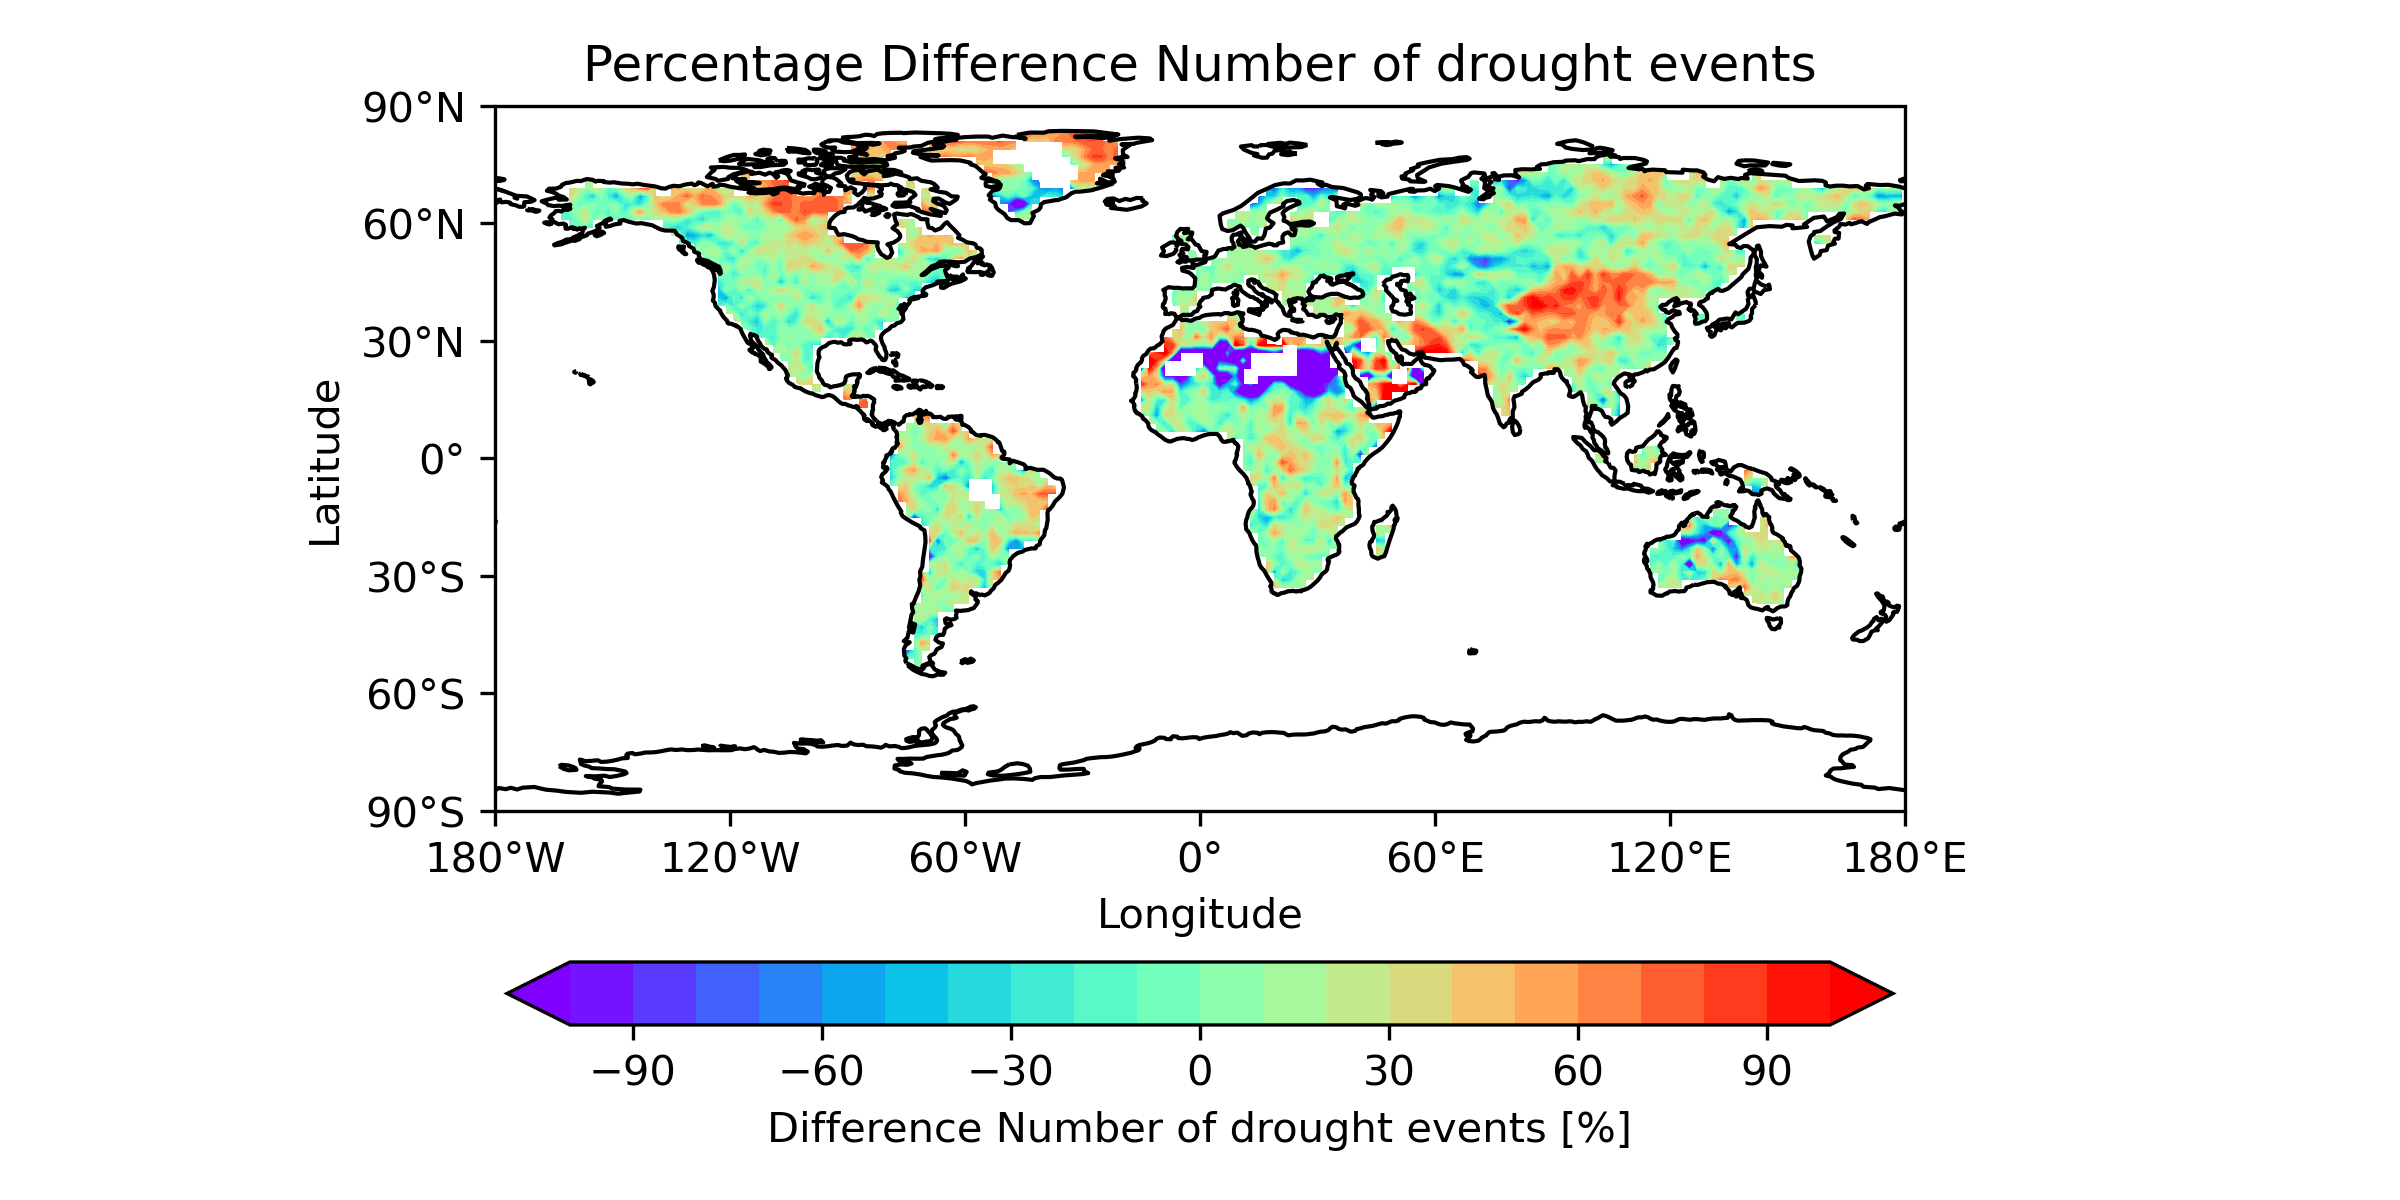
Fig. 161 Global map of the percentage difference between multi-model mean of 15 CMIP models and the CRU data for the number of drought events [%] based on SPI.#
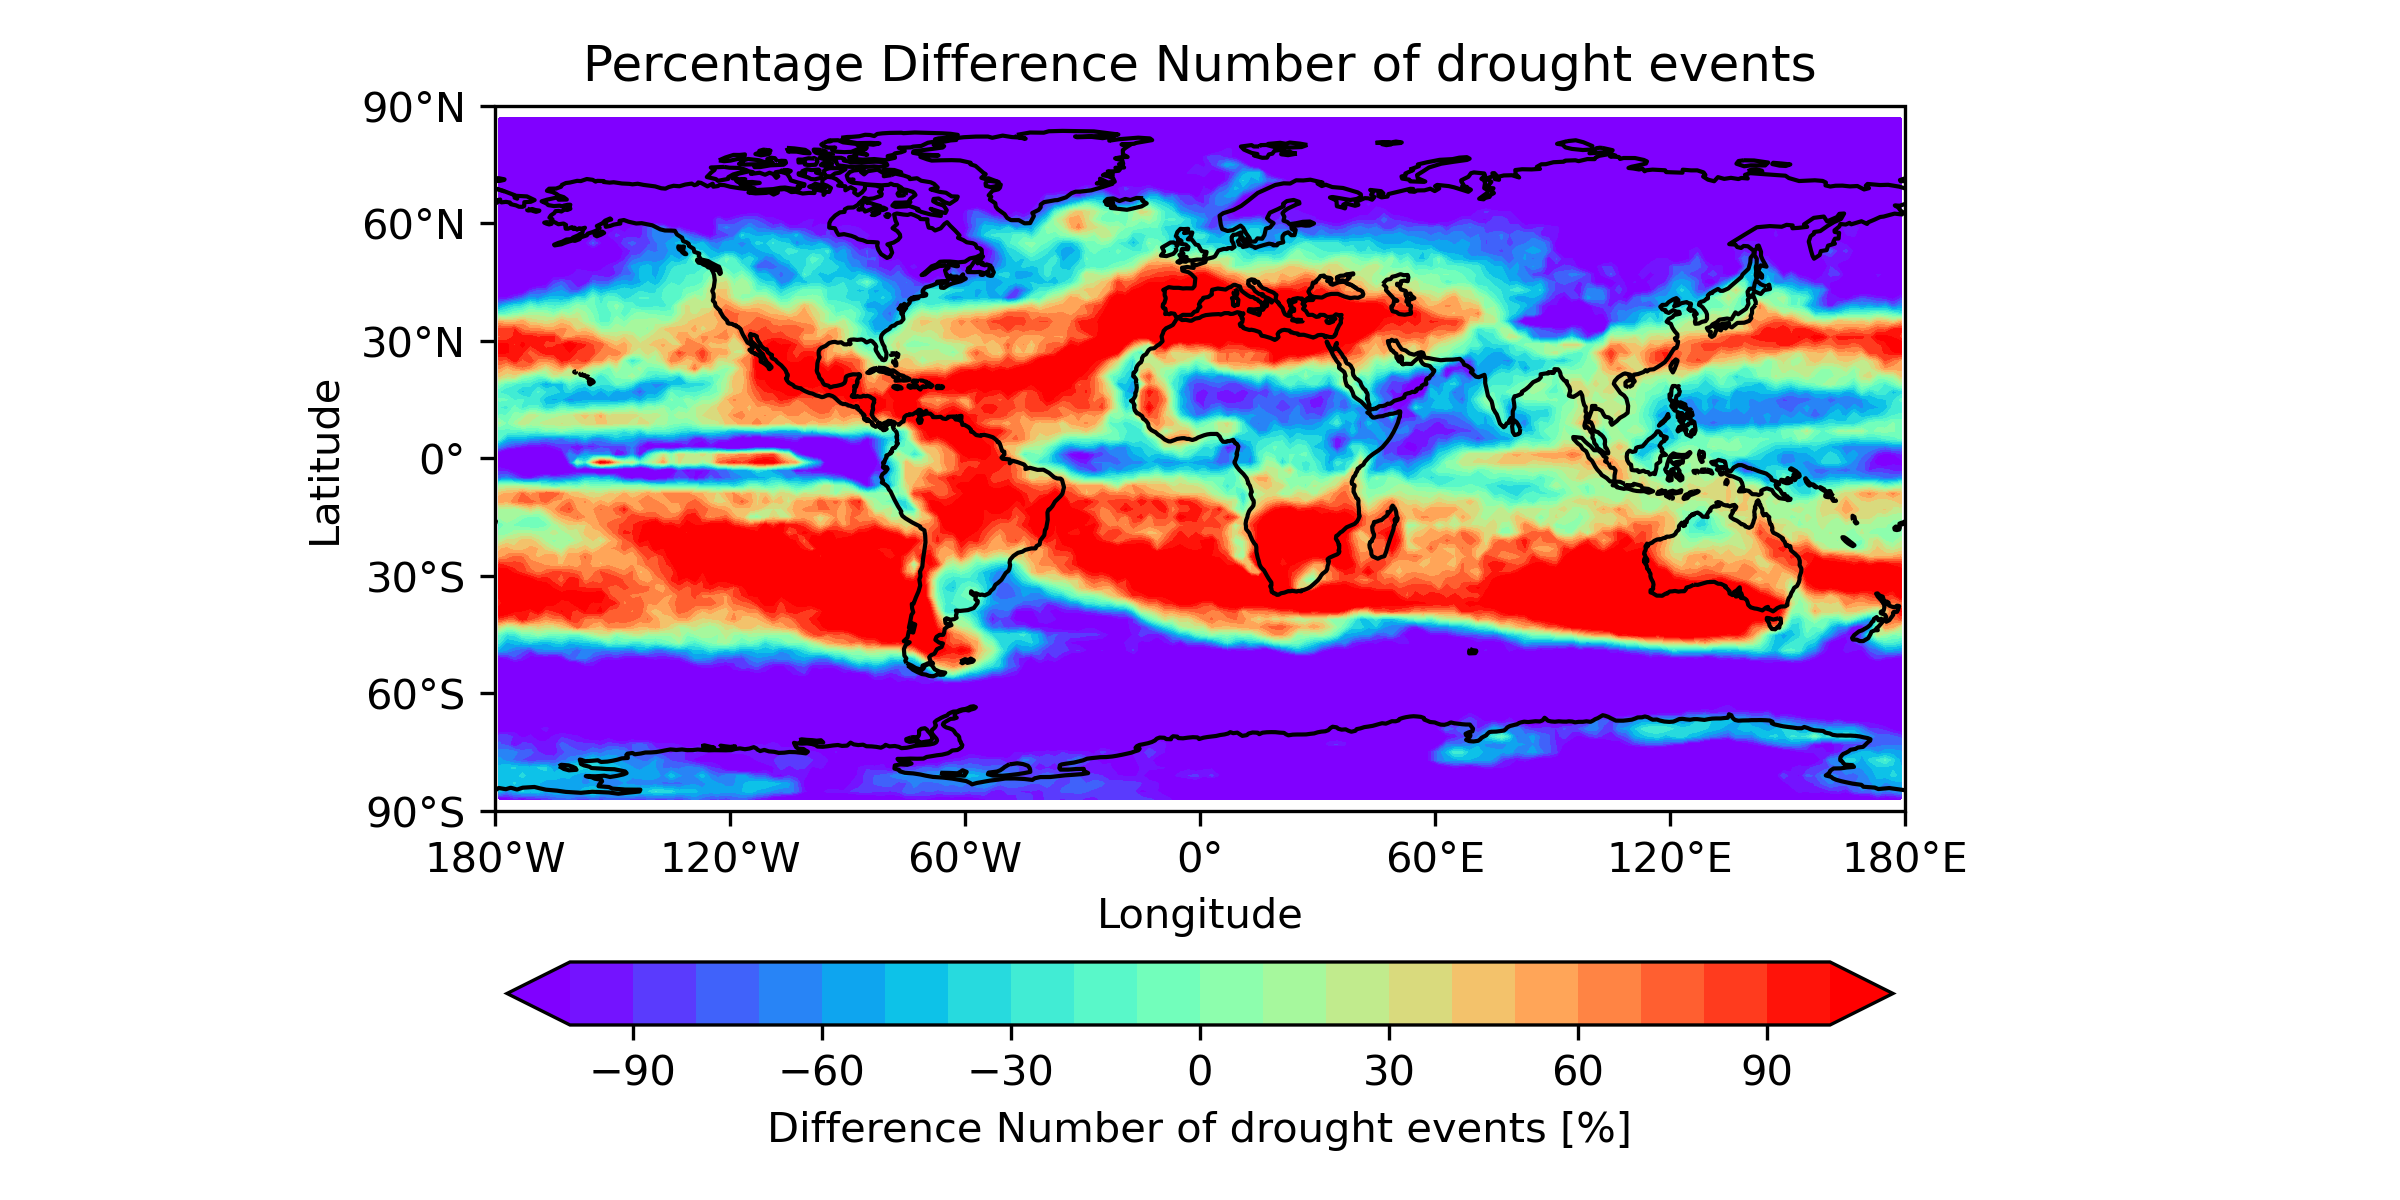
Fig. 162 Global map of the percentage difference between multi-model mean for RCP8.5 scenarios (2050-2100) runs and historical data (1950-2000) for 15 CMIP models for the number of drought events [%] based on SPI.#