Climate Change Hotspot#
Overview#
In the context of a changing climate, it is found that not all regions change at the same pace and the same way. The regions that change at a faster rate than the rest of the globe are labelled as climate change hotspots. Estimating the location and magnitude of the hotspots is important for climate change adaptation, and it is usually computed using the projected climate variables’ differences between the regional and larger scales.
One issue when trying to evaluate projections of climate change is the vast amount of information available from the Coupled Model Intercomparison Project (CMIP) exercises. Additionally, results from the CMIP phases 5 and 6 can be quite different, therefore a comparison between the two multi-model ensembles can be made to evaluate their differences and similarities. To account for the projections scenario uncertainty, data from three different end-of-the-century radiative forcings is given in the recipe.
This recipe compares regional surface temperature and precipitation against larger scale means to obtain the hotspot magnitudes for both CMIP5 and CMIP6 in the 2.6, 4.5 and 8.5 $Wm^-2$ radiative forcings by the year 2100 against the preindustrial Era (RCP2.6, RCP4.5, RCP8.5 for CMIP5 and SSP1-2.6, SSP2-4.5, SSP5-8.5 for CMIP6). Recipe based on the work by Cos et al. (2022).
Note: This recipe is currently set to evaluate the Mediterranean hotspot (with bounds start_longitude: -10, end_longitude: 40, start_latitude: 30, end_latitude: 45) but it can be set to any other rectangular region.
Available recipes and diagnostics#
Recipes are stored in esmvaltool/recipes/
recipe_climate_change_hotspot.yml: Loads and ensembles the data,computes the necessary climate change hotspot diagnostics and plots the results figures.
Diagnostics are stored in esmvaltool/diag_scripts/cos22esd/
climate_change_hotspot.py: Calculates the regional field hotspot for temperature and precipitation and the 10-year rolling mean timeseries for regional and large-scale temperature and precipitation.
hotspot_plotter.py: Gathers the data output from theclimate_change_hotspot.pyscript and plots the hotspot fields and the rolling mean timeseries [Figures 2, 3, S2 and S4 by Cos et al. (2022).].
User settings in the recipe#
Script
climate_change_hotspot.pyRequired settings for script
baseline_period: Historical period that serves as a reference to compute the time anomalies.future_periods: List of the two future periods given in years (“YYYY-YYYY”) where the hotspot will be computed. Following the format [future period #1, future period #2].region: list of longitudes and latitudes that enclose a rectangular region. In the form of [start_longitude, end_longitude, start_latitude, end_latitude].region_name: Name of the region to be included in the provenance record.
Script
hotspot_plotter.pyRequired settings for script
baseline_period: Historical period displayed in the figures’ titles.future_periods: List of the two future periods given in years (“YYYY-YYYY”), following the format [future period #1, future period #2], used to identify the ancestor files and in the figure titles.region: List of longitudes and latitudes that enclose a region. In the form of [start_longitude, end_longitude, start_latitude, end_latitude]. Used in the title to identify the precipitation large-scale region.region_name: Name of the region used in the plot titles.
Modifying the datasets and scenarios used#
recipe_climate_change_hotspot.yml can be modified to use different scenario combinations.
The standard recipe uses data from scenarios with the radiative forcings 2.6, 4.5 and 8.5 Wm^{-2} (referred to as 26, 45 and 85),
but any combination of three scenarios from the following list can be used:
26: "RCP2.6/SSP1-2.6"
45: "RCP4.5/SSP2-4.5"
60: "RCP6.0/SSP4-6.0"
85: "RCP8.5/SSP5-8.5"
To specify which datasets are available for each scenario, lists of datasets can be attributed to a
specific CMIP project and scenario between the documentation
and preprocessor sections of the recipe as follows:
cmip6_85: &cmip6_85
   - {...dataset keys...}
   - {...dataset keys...}
cmip5_85: &cmip5_85
   - {...dataset keys...}
   - {...dataset keys...}
cmip6_45: &cmip6_45
   - {...dataset keys...}
   - {...dataset keys...}
cmip5_45: &cmip5_45
   - {...dataset keys...}
   - {...dataset keys...}
These different dataset sections will be called at each diagnostic as additional_datasets using the
anchors *cmip6_85, *cmip5_85, etc. as in the example:
pr_cmip6_85:
 variables:
   pr:
     mip: Amon
     short_name: pr
     preprocessor: ensemble_members
     additional_datasets: *cmip6_85
 scripts:
   pr_cmip6_85:
     <<: *script_input
In case of wanting to use other scenarios, the datasets and diagnostics must be
changed maintaining the format cmip{phase}_{scenario} and {variable}_cmip{phase}_{scenario}.
For example, if we want scenario 60 instead of scenario 85, we would need to include the
files available for cmip6_60 and cmip5_60, and the previous diagnostic would change to:
pr_cmip6_60:
 variables:
   pr:
     mip: Amon
     short_name: pr
     preprocessor: ensemble_members
     additional_datasets: *cmip6_60
 scripts:
   pr_cmip6_60:
     <<: *script_input
Finally, if the datasets that need to be included in the multi-model means are common for all scenarios, the datasets could be simplified to:
cmip6: &cmip6
   - {...dataset keys...}
   - {...dataset keys...}
cmip5: &cmip5
   - {...dataset keys...}
   - {...dataset keys...}
Note that the diagnostics’ additional_datasets will need to be modified accordingly.
Variables#
tas (atmos, monthly mean, longitude latitude time)
pr (atmos, monthly mean, longitude latitude time)
References#
Cos et al. 2022, Earth Syst. Dynam., 13, 321–340
Example plots#
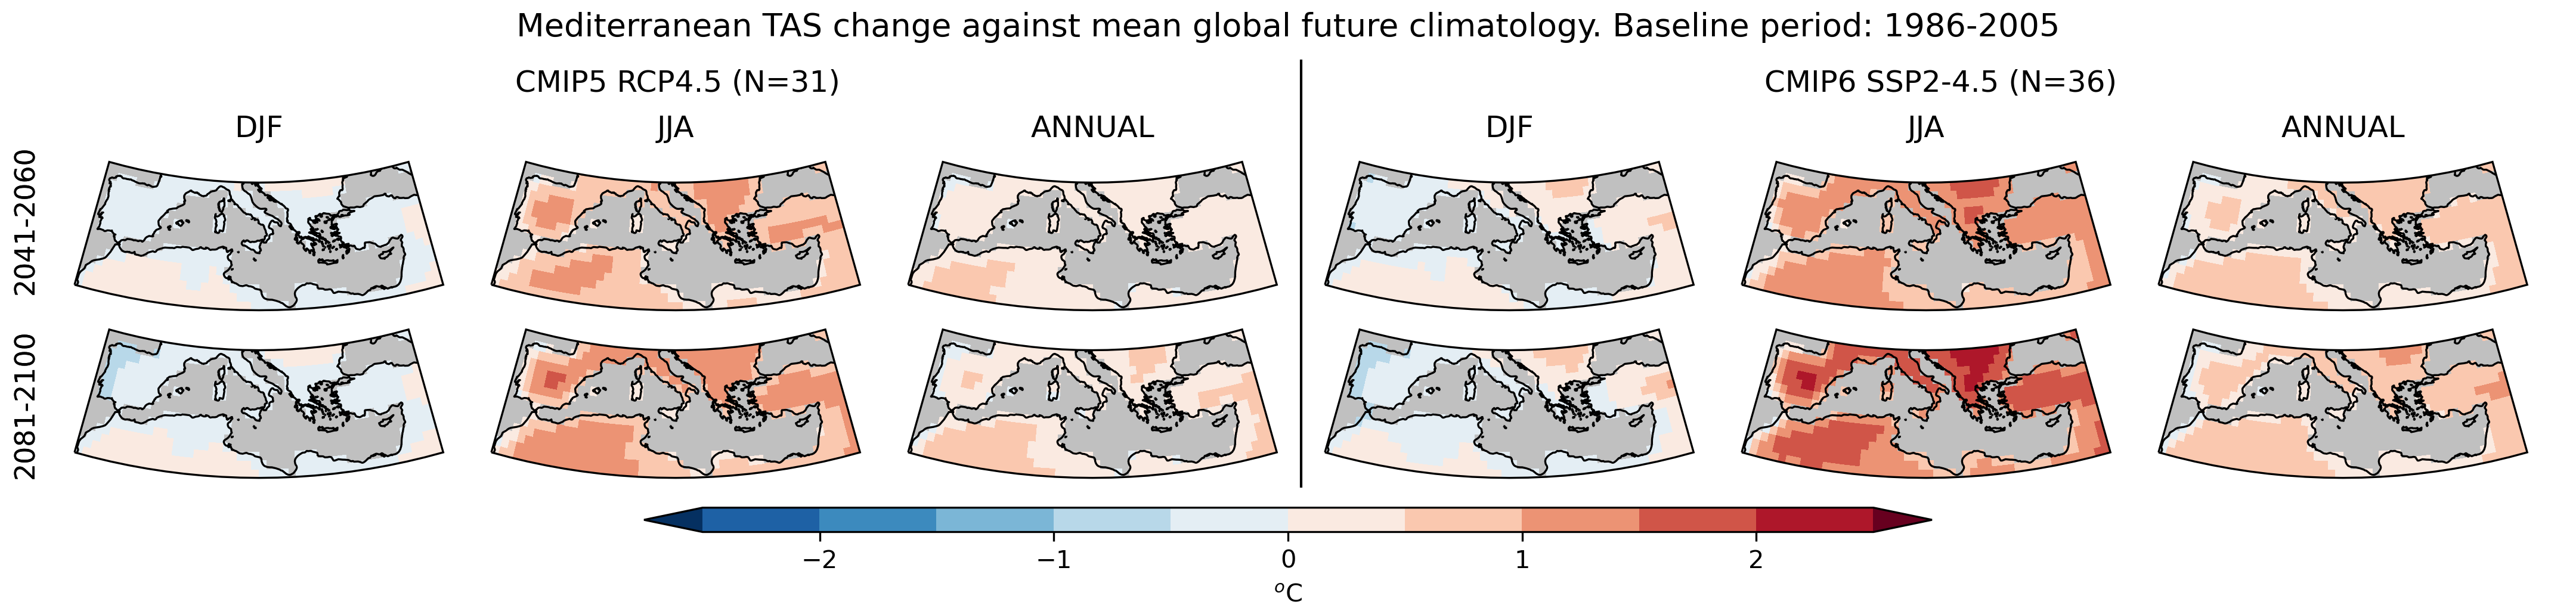
Fig. 267 Mediterranean region temperature change differences against the mean global temperature change. The changes for the periods 2041–2060 (first and third row) and 2081–2100 (second and fourth row) are evaluated against 1986–2005 mean. The differences are shown for the CMIP5 (left) and CMIP6 (right) DJF, JJA and annual mean projections (columns) under the high emission scenario RCP8.5 and SSP5-8.5 respectively. N indicates the number of models included in the ensemble mean.#
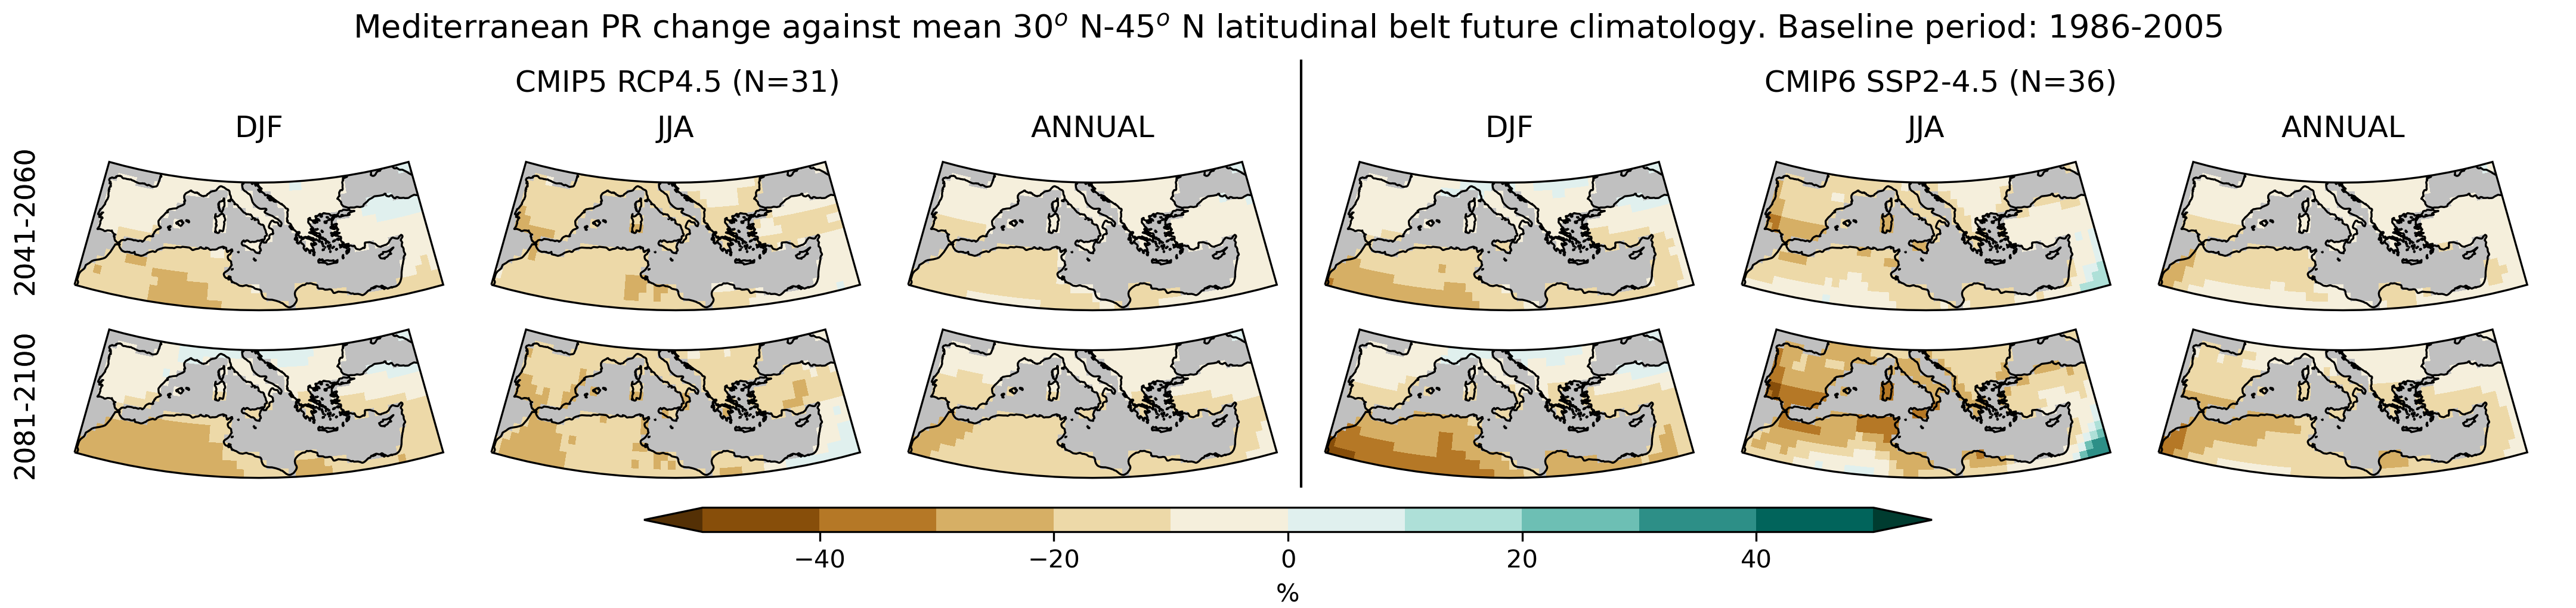
Fig. 268 Mediterranean region precipitation change differences against the mean 30–45º N latitudinal belt precipitation change respectively. The changes for the periods 2041–2060 (first and third row) and 2081–2100 (second and fourth row) are evaluated against 1986–2005 mean. The differences are shown for the CMIP5 (left) and CMIP6 (right) DJF, JJA and annual mean projections (columns) under the high emission scenario RCP8.5 and SSP5-8.5 respectively. N indicates the number of models included in the ensemble mean.#
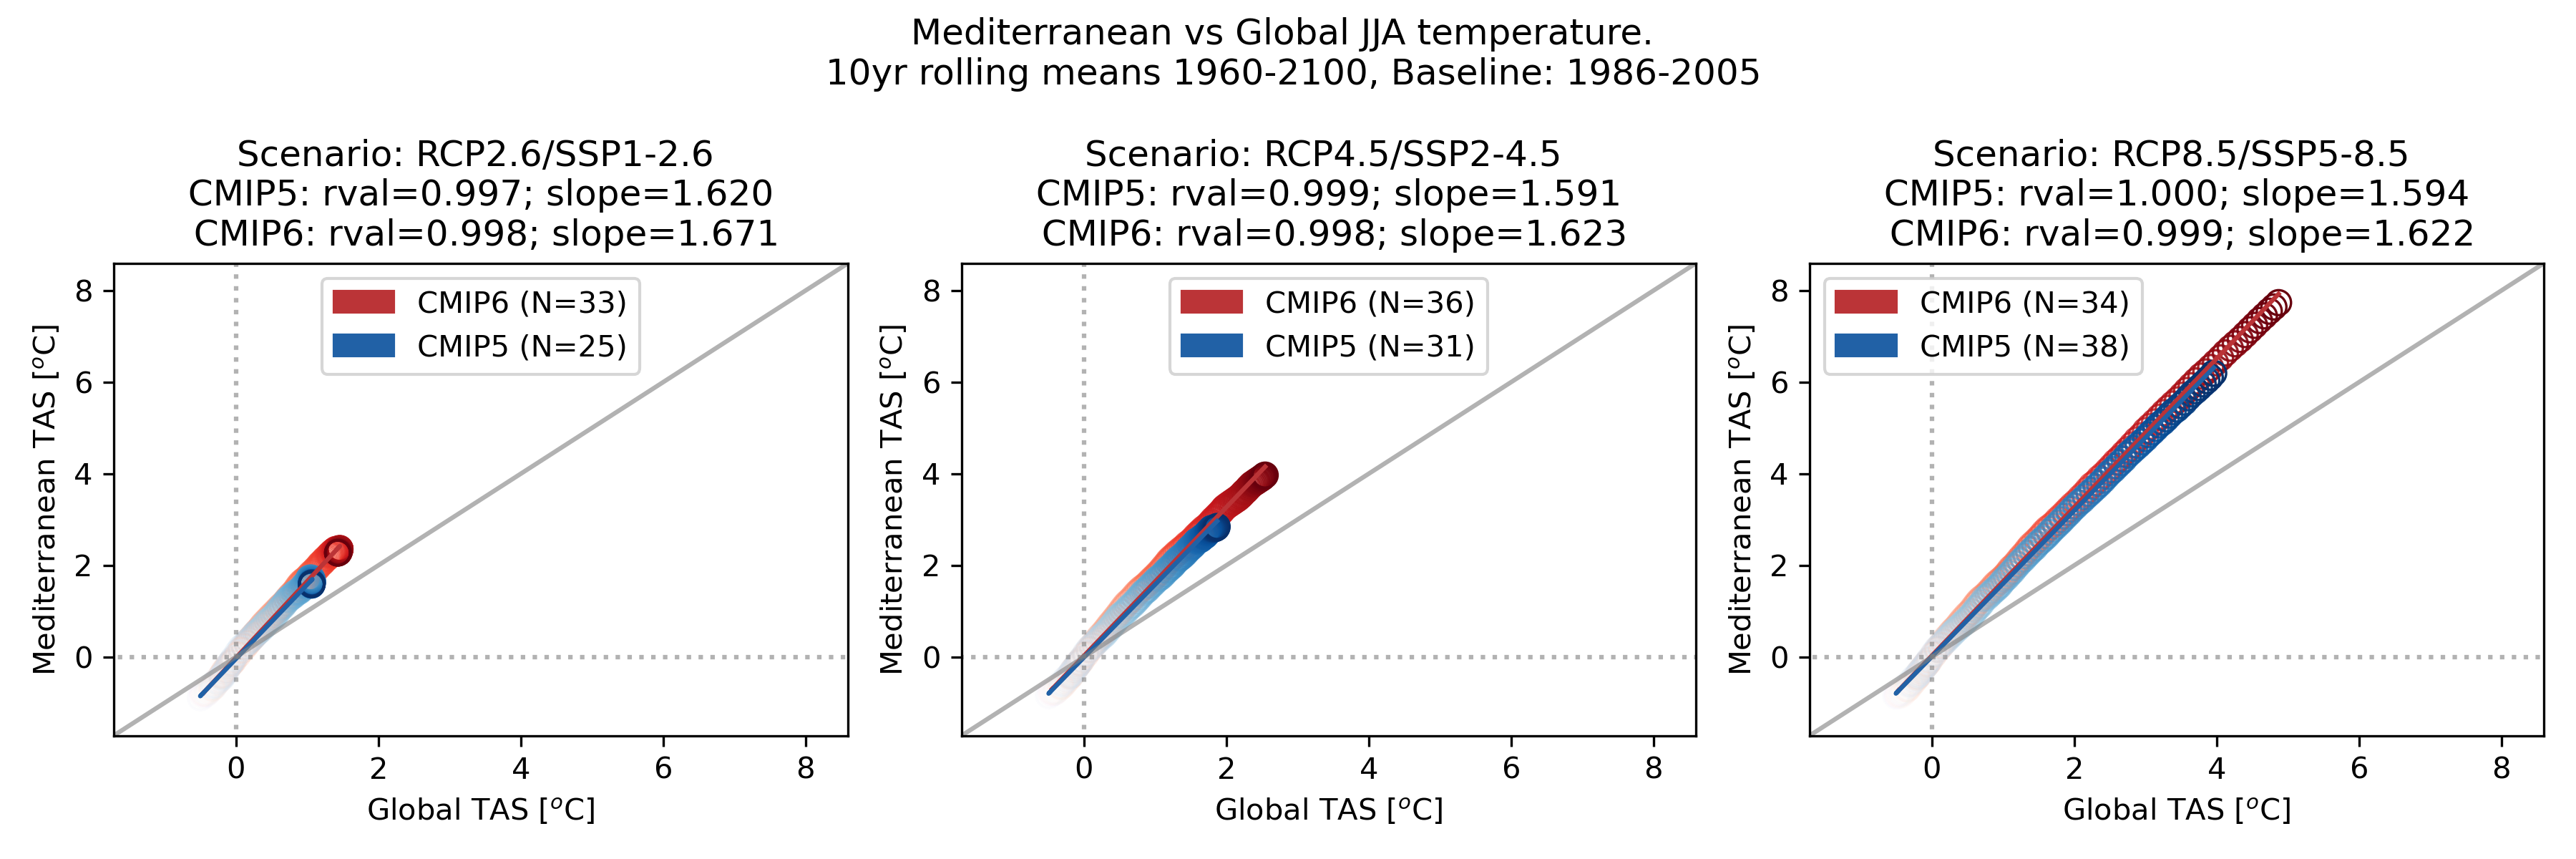
Fig. 269 Mediterranean region warming against global warming for the summer 2.6, 4.5 and 8.5 Wm^{-2} RCP and SSP scenarios for the CMIP5 and CMIP6 ensemble means. Each dot represents a 10-year mean change beginning from the period 1960-1969 (light colouring) until 2091-2100 (opaque coloring). The changes are computed with 1986-2005 as the baseline. An ordinary least squares linear regression is computed and the slope and $r$ values are shown. N indicates the number of models included in the ensemble mean.#