Timeseries for Arctic-Midlatitude Teleconnections#
Overview#
The recipe produces the timeseries of selected variables to study Arctic-midlatitude teleconnections for further application of Causal Model Evaluation (CME) described in Galytska et al. (2023).
The output of the recipe consists of the .nc files named after the data source (e.g. ERA5, ACCESS-CM2.nc etc.). Each file contains the area-weighted spatial average of climatological monthly anomalies of selected variables. The recipe also applies the CVDP package.
Available recipes and diagnostics#
Recipes are stored in esmvaltool/recipes/
recipe_galytska23jgr.yml
Diagnostics are stored in esmvaltool/diag_scripts/
galytska23/select_variables_for_tigramite.py
cvdp/cvdp_wrapper.py
User settings in recipe#
Preprocessor
anomalies(period: monthly): Calculate anomalies for selected variablesregrid(target_grid: 1x1): Linear regridding of all datasets to the uniform gridarea_statistics(operation: mean): Calculate mean over defined regions
Script <select_variables_for_tigramite.py>
none
Script <cvdp_wrapper.py>
none
Script <cvdp/cvdp/driver.ncl>
modular(modular: True): Run the diagnostics that is selected inmodular_listmodular_list(modular_list: psl.nam_nao): Calculate only NAO diagnostics
Variables#
zg (atmos, monthly mean, longitude latitude time)
tas (atmos, monthly mean, longitude latitude time)
psl (atmos, monthly mean, longitude latitude time)
va (atmos, monthly mean, longitude latitude time)
ta (atmos, monthly mean, longitude latitude time)
sic/siconc (seaice, monthly mean, longitude latitude time)
ts (atmos, monthly mean, longitude latitude time)
pr (atmos, monthly mean, longitude latitude time)
Observations and reformat scripts#
ERA5 (pr, psl, ta, tas, ts, va, zg - ERA5 data can be used via the native6 project)
HadISST - (sic - esmvaltool/cmorizers/data/formatters/datasets/hadisst.ncl)
References#
Galytska, E., Weigel, K., Handorf, D., Jaiser, R., Köhler, R. H., Runge, J., & Eyring, V.: Causal model evaluation of Arctic-midlatitude teleconnections in CMIP6. Authorea Preprints. https://doi.org/10.1002/essoar.10512569.1.
Copernicus Climate Change Service (C3S), 2017: ERA5: Fifth generation of ECMWF atmospheric reanalyses of the global climate, edited, Copernicus Climate Change Service Climate Data Store (CDS). https://cds.climate.copernicus.eu/cdsapp#!/home
Example plots#
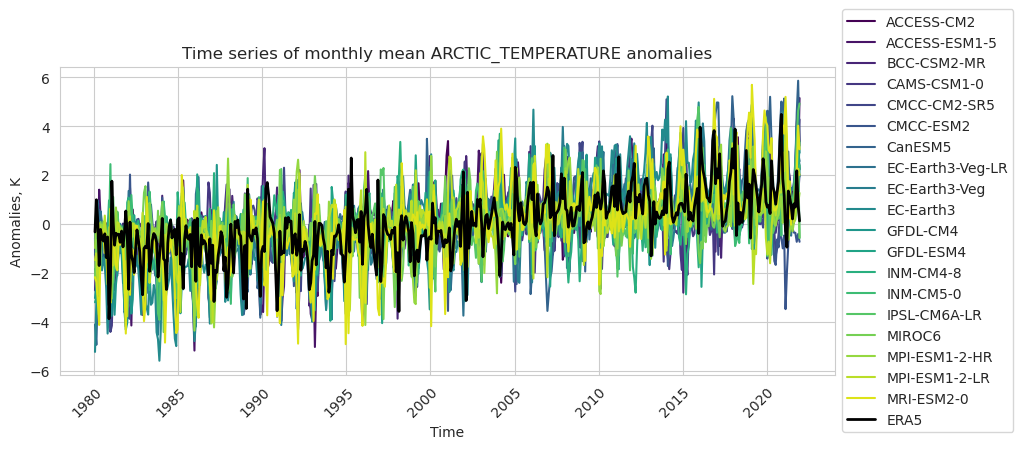
Fig. 391 Monthly mean temperature anomalies in the Arctic (65°–90°N) from observations and selected CMIP6 models during 1980-2021.#