Ocean chlorophyll in ESMs compared to ESA-CCI observations.#
Overview#
This recipe compares monthly surface chlorophyll from CMIP models to ESA CCI ocean colour chlorophyll (ESACCI-OC). The observations are the merged sensor geographic monthly L3S chlor_a data Sathyendranath et al. (2019). Multiple models and different observational versions can be used by the script.
The recipe_esacci_oc.yml produces an image showing four maps. Each of these four maps shows latitude vs longitude and the chlorophyll value. The four plots are: ESACCI-OC v5.0 chlorophyll, the CMIP6 model, the bias model-observation and the ratio model/observations. The script also produces a scatter plot for all coordinates with the model on the x-axis and the observations on the y axis and a line of best fit with the parameter values given in the panel.
Available recipes and diagnostics#
Recipes are stored in esmvaltool/recipes/ocean/
recipe_esacci_oc.yml
Diagnostics are stored in esmvaltool/diag_scripts/ocean/
diagnostic_model_vs_obs.py
User settings in recipe#
Script diagnostic_model_vs_obs.py
Required settings for script
observational_dataset: name of reference dataset (e.g. {dataset: ESACCI-OC,})
Variables#
chl (ocean, monthly mean, longitude, latitude, time)
Observations and reformat scripts#
ESACCI-OC (chl)
Reformat script: reformat_scripts/obs/reformat_obs_esacci_oc.py
References#
Sathyendranath, S., et al. (2019), An ocean-colour time series for use in climate studies: the experience of the Ocean-Colour Climate Change Initiative (OC-CCI). Sensors: 19, 4285. doi:10.3390/s19194285.
ESACCI-OC dataset: http://dx.doi.org/10.5285/00b5fc99f9384782976a4453b0148f49
Example plots#
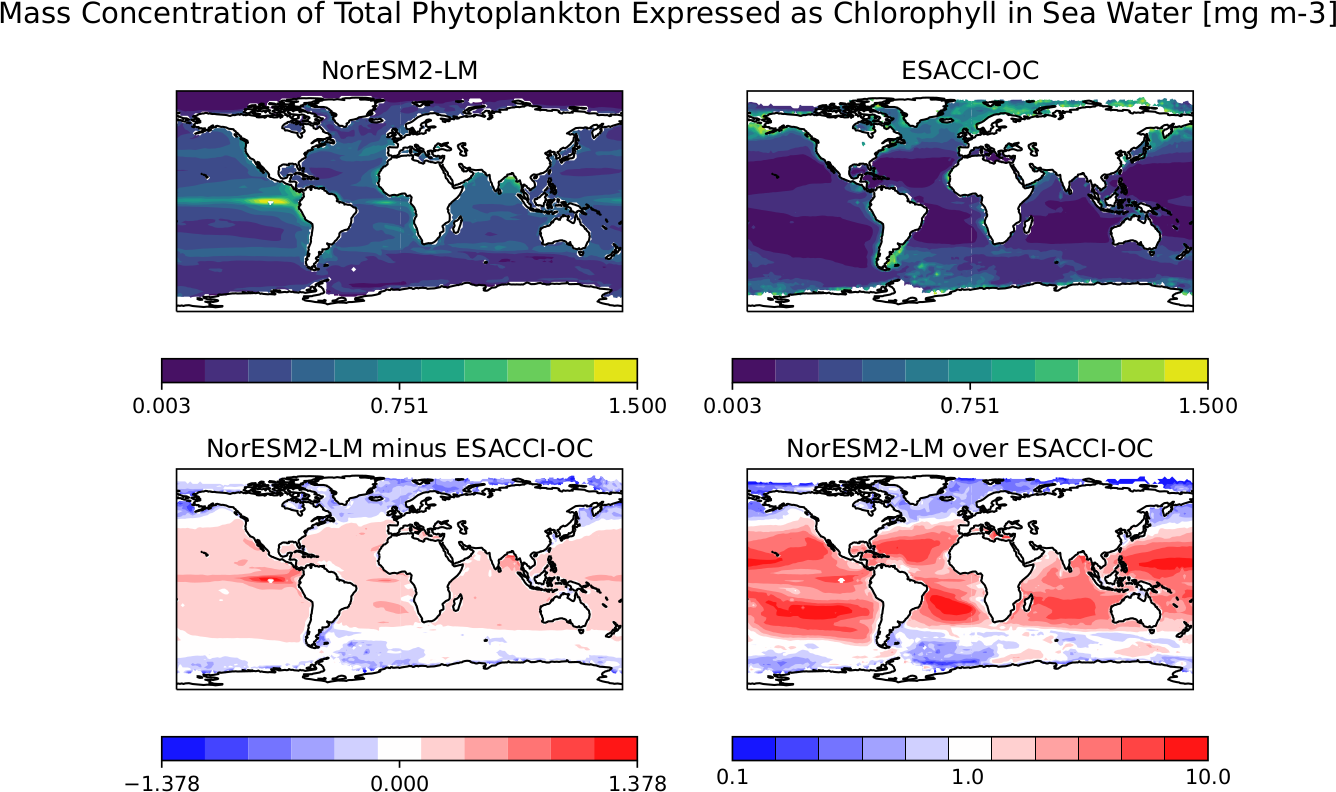
Fig. 352 Surface chlorophyll from ESACCI-OC ocean colour data version 5.0 and the CMIP6 model NorESM2-LM. This model overestimates chlorophyll compared to the observations.#
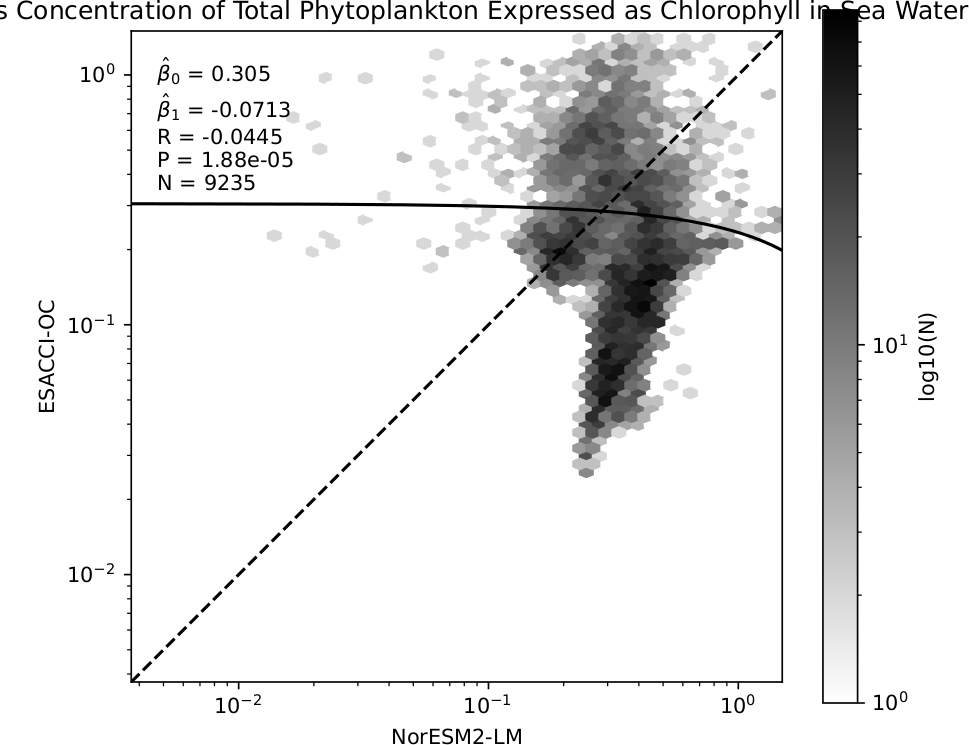
Fig. 353 Scatter plot of surface chlorophyll from ESACCI-OC ocean colour data version 5.0 and the CMIP6 model NorESM2-LM.#