Spatially resolved evaluation of ESMs with satellite column-averaged CO2#
Overview#
This recipe reproduces the figures of Gier et al. (2020). It uses satellite column-averaged CO2 data to evaluate ESMs by plotting several quantities such as timeseries, seasonal cycle and growth rate in different areas.
Available recipes and diagnostics#
Recipes are stored in esmvaltool/recipes/
recipe_gier20bg.yml
Diagnostics are stored in diag_scripts/
Diagnostics are stored in esmvaltool/diag_scripts/xco2_analysis/
carbon_plots.ncl: plot script for panel plots
delta_T.ncl: IAV of growth rate against growing season temperature - Figure C1
global_maps.ncl: global maps for seasonal cycle amplitude - Figures 5, 6
main.ncl: Timeseries and histogram - Figures 3, 4
panel_plots.ncl: scatter plot of SCA/GR vs variable - Figures 7, 9, B1, B2
sat_masks.ncl: data coverage of input data - Figures 1, 8
stat.ncl: auxiliary functions for GR, SCA computation
station_comparison.ncl: - comparison of surface and column data - Figure 2
User settings in recipe#
Preprocessor
conv_units: converts units to plot-unitsmmm_ref: calculates multi-model mean and regrids to ref datasetmmm_2x2: computes multi-model mean on 2x2 gridmmm: computes multi-model mean for 3D variable, 5x5 grid with specific pressure levels
Script xco2_analysis/delta_T.ncl
- Required diag_script_info attributes:
region: region to average overmasking: the kind of masking to apply prior to region average (possible options: obs, land, sciamachy, gosat, none)var_order: First main variable, then temperature variable to compare
- Optional diag_script_info attributes:
styleset: styleset for color coding panelsoutput_file_type: output file type for plots, default: pngvar_plotname: NCL string formatting how variable should be named in plots defaults to short_name if not assigned.
Script xco2_analysis/global_maps.ncl:
- Required diag_script_info attributes:
contour_max_level: maximum value displayed for seasonal cycle amplitude contour plot
- Optional diag_script_info attributes:
output_file_type: output file type for plots, default: png
Script xco2_analysis/main.ncl:
- Required diag_script_info attributes:
styleset: styleset to use for plotting colors, linestyles…region: latitude range for averagingmasking: different masking options are available to use on dataset: (possible options: none, obs)ensemble_mean: if true calculates multi-model mean only accounting for the ensemble member named in “ensemble_refs”
- Optional diag_script_info attributes:
output_file_type: output file type for plots, default: pngensemble_refs: list of model-ensemble pairs to denote which ensemble member to use for calculating multi-model mean. required if ensemble_mean = truevar_plotname: String formatting how variable should be named in plots defaults to short_name if not assigned
Script xco2_analysis/panel_plots.ncl:
- Required diag_script_info attributes:
styleset: styleset to use for plotting colors, linestyles…region: latitude range for averagingmasking: different masking options are available to use on dataset: (possible options: obs, land, sciamachy, gosat, none)obs_in_panel: True if observations should be included in plotarea_avg: Type of area averaging: “full-area” normal area-average “lat-first” calculate zonal means first, then average theseplot_var2_mean: If True adds mean of seasonal cycle to panel as string.
- Optional diag_script_info attributes:
output_file_type: output file type for plots, default: pngvar_plotname: String formatting how variable should be named in plots defaults to short_name if not assigned
Script xco2_analysis/sat_masks.ncl:
- Optional diag_script_info attributes:
output_file_type: output file type for plots, default: pngvar_plotname: String formatting how variable should be named in plots defaults to short_name if not assignedc3s_plots: Missing value plots separated by timeseries of c3s satellites
Script xco2_analysis/station_comparison.ncl:
- Required diag_script_info attributes:
var_order: in this case xco2, co2, co2s - column averaged with obs dataset first, then 2D variable, followed by surface stations
- Optional diag_script_info attributes:
output_file_type: output file type for plots, default: pngvar_plotnames: String formatting how variables should be named in plots defaults to short_name if not assignedoverwrite_altitudes: Give other altitude values than the ones attached in the station data. Valid if altitude changes and timeseries spans range with different sample altitude. Caveat: If used, need to give altitude values for all stations.output_map: boolean if stations to be displayed on map. As this requires finetuning, currently only implemented for station set of (ASK, CGO, HUN, LEF, WIS) following the paper. Change for different plot inset locations, if others are desired.
Variables#
xco2 (atmos, monthly, longitude, latitude, time)
co2s (atmos, monthly, longitude, latitude, time)
co2 (atmos, monthly, pressure, longitude, latitude, time)
tas (atmos, monthly, longitude, latitude, time)
tasa (atmos, monthly, longitude, latitude, time)
Observations and reformat scripts#
References#
Gier, B. K., Buchwitz, M., Reuter, M., Cox, P. M., Friedlingstein, P., and Eyring, V.: Spatially resolved evaluation of Earth system models with satellite column-averaged CO2, Biogeosciences, 17, 6115–6144, https://doi.org/10.5194/bg-17-6115-2020, 2020.
Example plots#
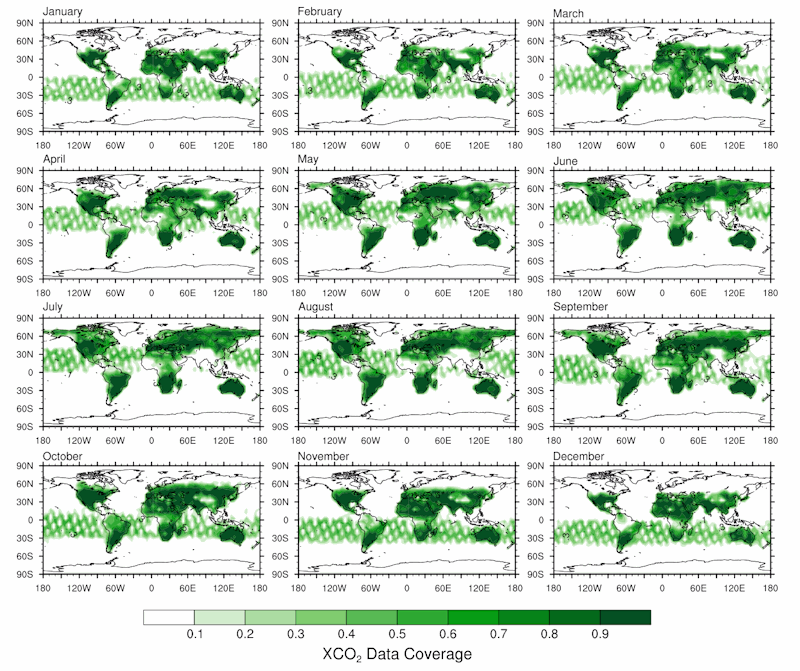
Fig. 167 Mean fractional coverage of monthly satellite data.#
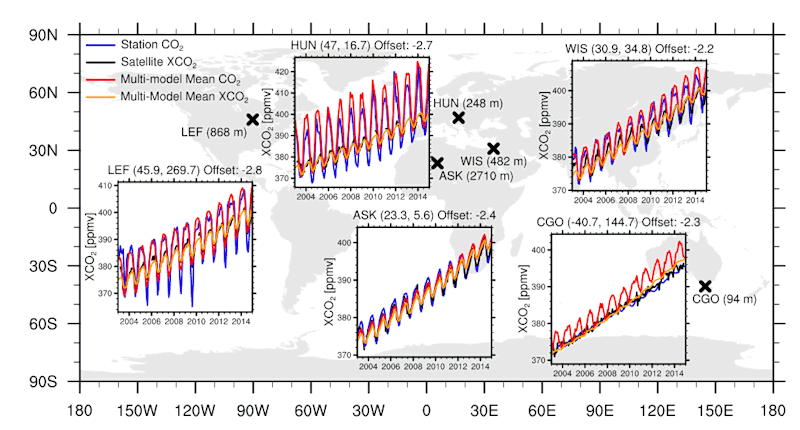
Fig. 168 Comparison of time series from satellite, in situ, and models sampled accordingly. Caveat: inset plot positions are hardcoded.#
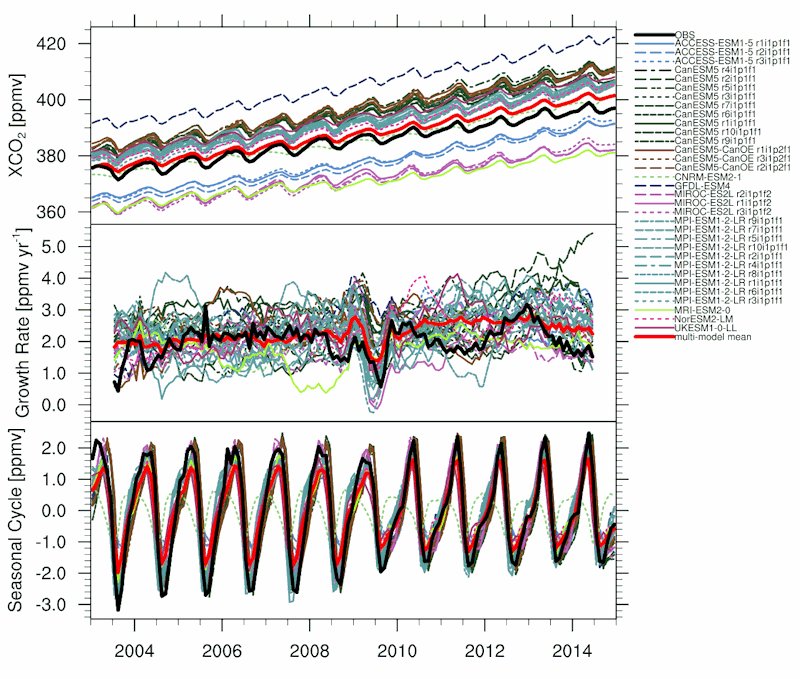
Fig. 169 Timeseries with panels depicting growth rate and seasonal cycle.#
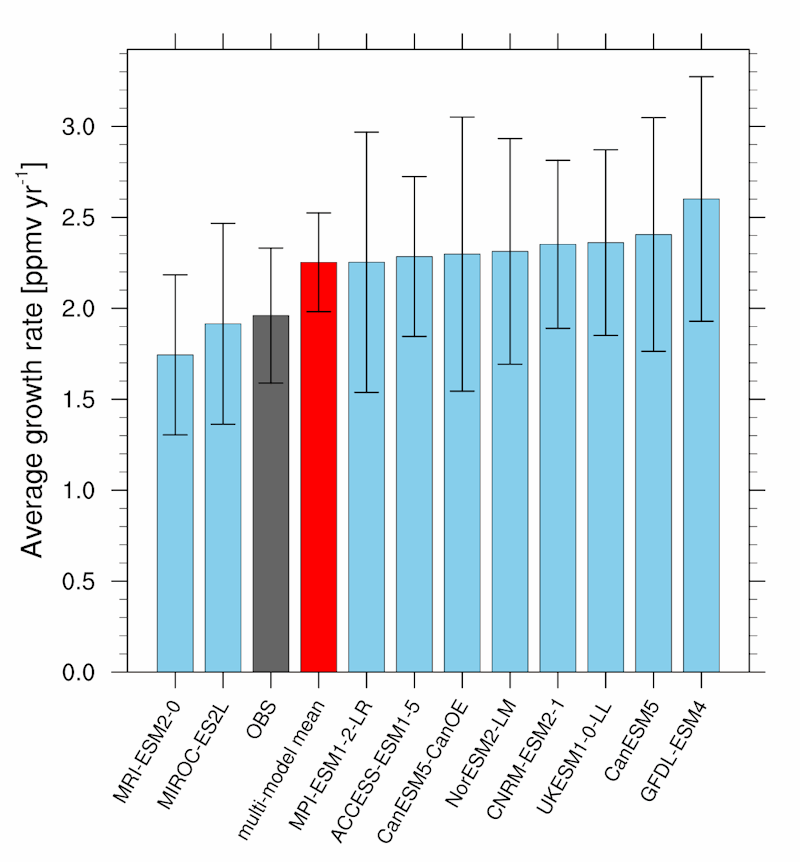
Fig. 170 Barplot of the growth rate, averaged over all years, with standard deviation of interannual variability.#
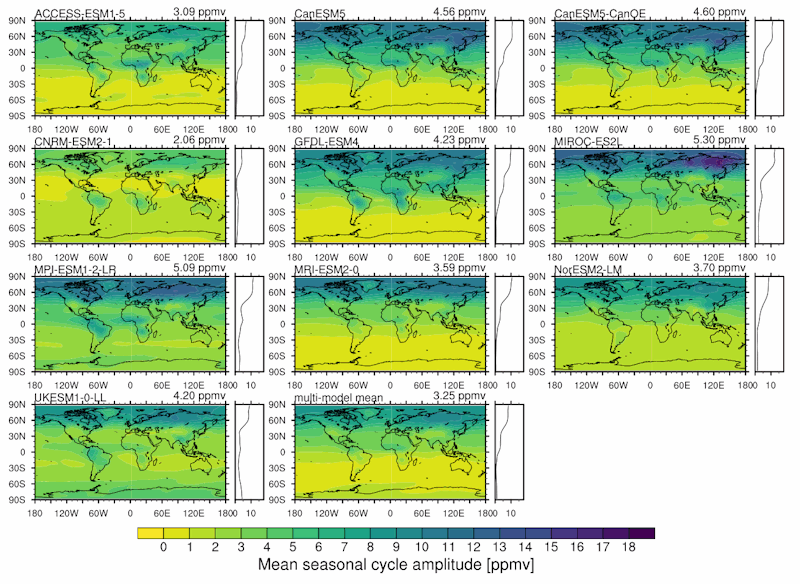
Fig. 171 Panel plot of spatially resolved seasonal cycle amplitude for all models, including a zonal average sidepanel.#
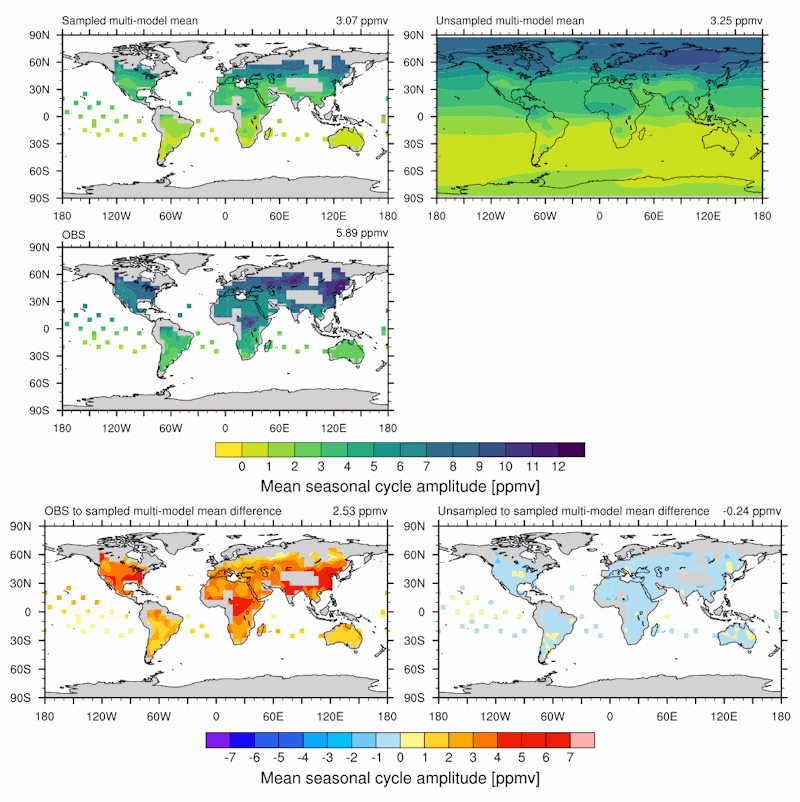
Fig. 172 Seasonal cycle amplitude map comparing influence of sampling, and difference to observations.#
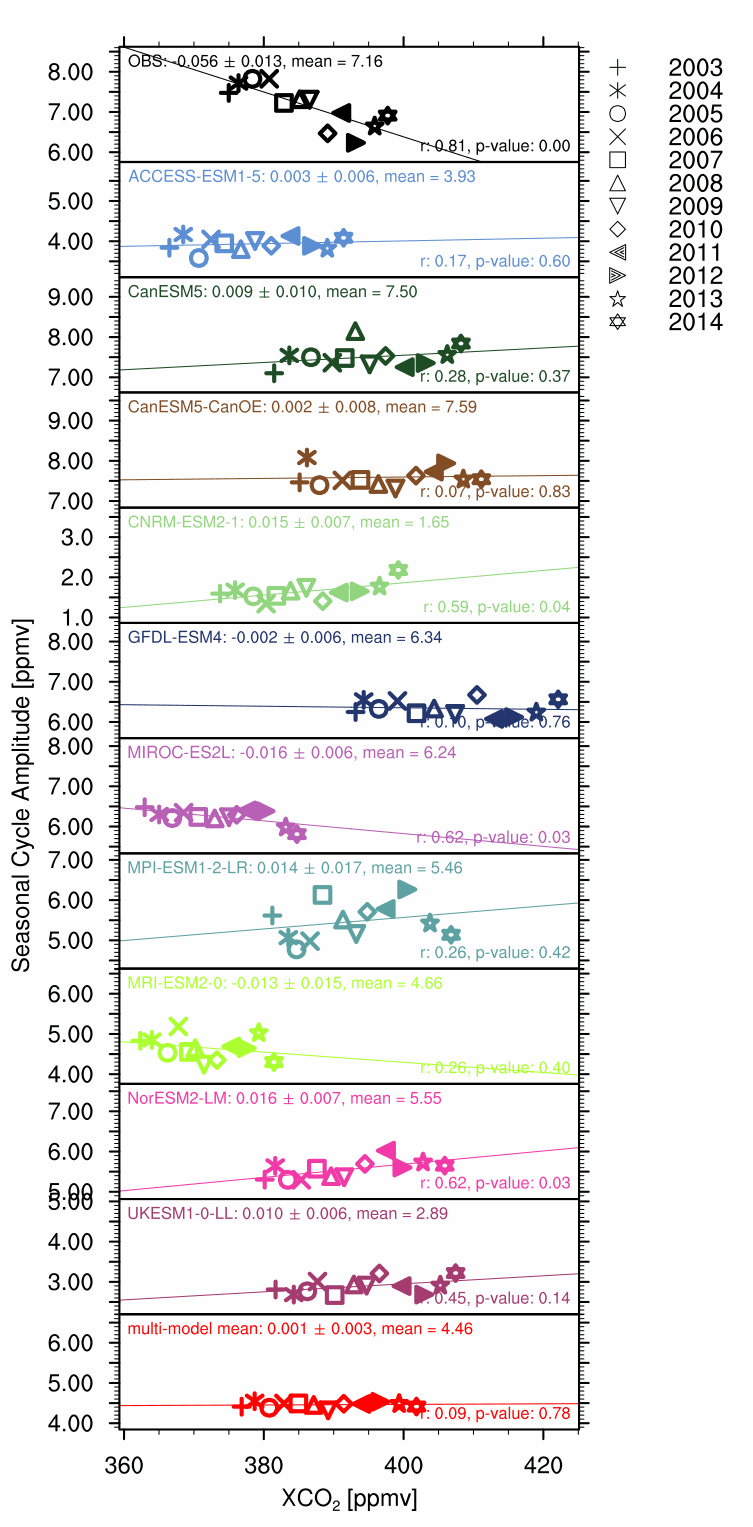
Fig. 173 Panel plots showing seasonal cycle amplitude against XCO2, includes regression line and p-value.#
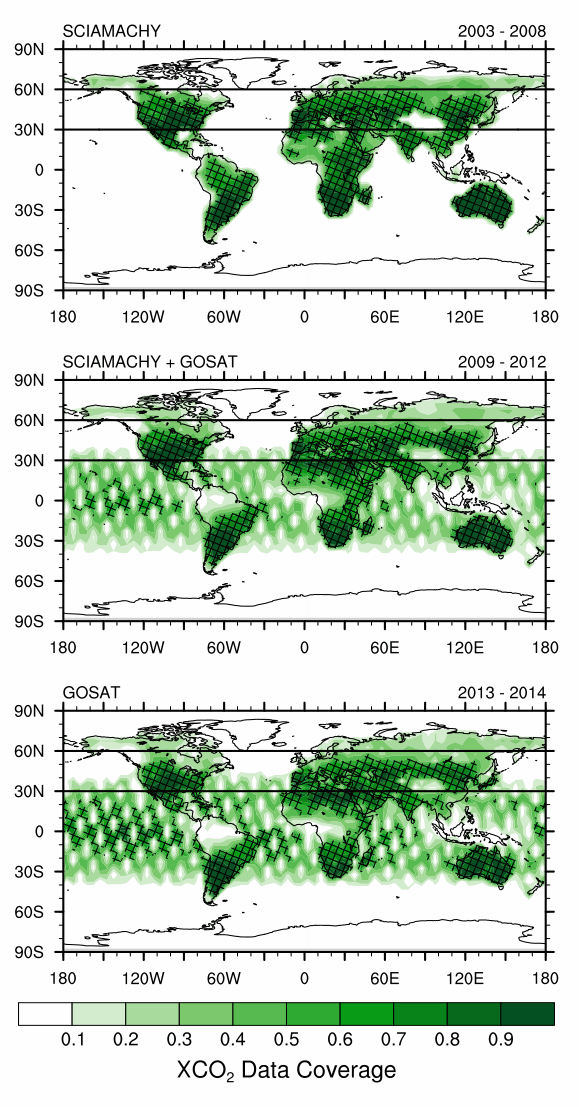
Fig. 174 Mean spatial data coverage for different satellites.#