Hydroclimatic intensity and extremes (HyInt)#
Overview#
The HyInt tool calculates a suite of hydroclimatic and climate extremes indices to perform a multi-index evaluation of climate models. The tool firstly computes a set of 6 indices that allow to evaluate the response of the hydrological cycle to global warming with a joint view of both wet and dry extremes. The indices were selected following Giorgi et al. (2014) and include the simple precipitation intensity index (SDII) and extreme precipitation index (R95), the maximum dry spell length (DSL) and wet spell length (WSL), the hydroclimatic intensity index (HY-INT), which is a measure of the overall behaviour of the hydroclimatic cycle (Giorgi et al., 2011), and the precipitation area (PA), i.e. the area over which at any given day precipitation occurs, (Giorgi et al., 2014). Secondly, a selection of the 27 temperature and precipitation -based indices of extremes from the Expert Team on Climate Change Detection and Indices (ETCCDI) produced by the climdex (https://www.climdex.org) library can be ingested to produce a multi-index analysis. The tool allows then to perform a subsequent analysis of the selected indices calculating timeseries and trends over predefined continental areas, normalized to a reference period. Trends are calculated using the R lm function and significance testing performed with a Student T test on non-null coefficients hypothesis. Trend coefficients are stored together with their statistics which include standard error, t value and Pr(>|t|). The tool can then produce a variety of types of plots including global and regional maps, maps of comparison between models and a reference dataset, timeseries with their spread, trend lines and summary plots of trend coefficients.
The hydroclimatic indices calculated by the recipe_hyint.yml and included in the output are defined as follows:
PRY = mean annual precipitation
INT = mean annual precipitation intensity (intensity during wet days, or simple precipitation intensity index SDII)
WSL = mean annual wet spell length (number of consecutive days during each wet spell)
DSL = mean annual dry spell lenght (number of consecutive days during each dry spell)
PA = precipitation area (area over which of any given day precipitation occurs)
R95 = heavy precipitation index (percent of total precipitation above the 95% percentile of the reference distribution)
HY-INT = hydroclimatic intensity. HY-INT = normalized(INT) x normalized(DSL).
The recipe_hyint_extreme_events.yml includes an additional call to the Extreme Events Indices (ETCCDI) diagnostics, which allows to calculate the ETCCDI indices and include them in the subsequent analysis together with the hydroclimatic indices. All of the selected indices are then stored in output files and figures.
Available recipes and diagnostics#
Recipes are stored in recipes/
recipe_hyint.yml (evaluating the 6 hydroclimatic indices, performing trend analysis and plotting)
recipe_hyint_extreme_events.yml (similar to the recipe_hyint.yml but with an additional call to the Extreme Events Indices (ETCCDI) diagnostic for calculation of ETCCDI indices and inclusion of them in the trend analysis and plotting)
Diagnostics are stored in diag_scripts/hyint/
hyint.R
and subroutines
hyint_diagnostic.R
hyint_functions.R
hyint_parameters.R
hyint_plot_trends.R
hyint_etccdi_preproc.R
hyint_metadata.R
hyint_plot_maps.R
hyint_preproc.R
hyint_trends.R
See details of the extreme_events diagnostics under recipe_extreme_events.yml.
Known issues#
recipe_hyint_extreme_events.yml
Call to the Extreme Events Indices (ETCCDI) diagnostic requires the ncdf4.helpers library, which is currently unavailable on CRAN. Users need therefore to install the library manually, e.g. through the following commands to download the package tarball from CRAN archive, install it and remove the package tarball:
url <- “https://cran.r-project.org/src/contrib/Archive/ncdf4.helpers/ncdf4.helpers_0.3-3.tar.gz”
pkgFile <- “ncdf4.helpers_0.3-3.tar.gz”
download.file(url = url, destfile = pkgFile)
install.packages(pkgs=pkgFile, type=”source”, repos=NULL)
unlink(pkgFile)
User settings#
Required settings for script
norm_years: first and last year of reference normalization period to be used for normalized indices
select_indices: indices to be analysed and plotted. Select one or more fields from the following list (order-sensitive): “pa_norm”, “hyint”, “int_norm”, “r95_norm”, “wsl_norm”, “dsl_norm”, “int”, “dsl”, “wsl”
select_regions: Select regions for timeseries and maps from the following list: GL=Globe, GL60=Global 60S/60N, TR=Tropics (30S/30N), SA=South America, AF=Africa, NA=North America, IN=India, EU=Europe, EA=East-Asia, AU=Australia
plot_type: type of figures to be plotted. Select one or more from: 1=lon/lat maps per individual field/exp/multi-year mean, 2=lon/lat maps per individual field exp-ref-diff/multi-year mean, 3=lon/lat maps multi-field/exp-ref-diff/multi-year mean, 11=timeseries over required individual region/exp, 12=timeseries over multiple regions/exp, 13=timeseries with multiple models, 14=summary trend coefficients multiple regions, 15=summary trend coefficients multiple models
Additional settings for recipe_hyint_extreme_events.yml
call to the extreme_events diagnostics: see details in recipe_extreme_events.yml. Make sure that the base_range for extreme_events coincides with the norm_range of hyint and that all ETCCDI indices that are required to be imported in hyint are calculated by the extreme_events diagnostics.
etccdi_preproc: set to true to pre-process and include ETCCDI indices in hyint
etccdi_list_import: specify the list of ETCCDI indices to be imported, e.g.: “tn10pETCCDI”, “tn90pETCCDI”, “tx10pETCCDI”, “tx90pETCCDI”
select_indices: this required settings should here be revised to include the imported indices, e.g.: “pa_norm”, “hyint”, “tn10pETCCDI”, “tn90pETCCDI”, “tx10pETCCDI”, “tx90pETCCDI”
Optional settings for script (with default setting)
Data
rgrid (false): Define whether model data should be regridded. (a) false to keep original resolution; (b) set desired regridding resolution in cdo format e.g., “r320x160”; (c) “REF” to use resolution of reference model
Plotting
npancol (2): number of columns in timeseries/trends multipanel figures
npanrow (3): number of rows in timeseries/trends multipanel figures
autolevels (true): select automated (true) or pre-set (false) range of values in plots
autolevels_scale (1): factor multiplying automated range for maps and timeseries
autolevels_scale_t (1.5): factor multiplying automated range for trend coefficients
Maps
oplot_grid (false): plot grid points over maps
boxregion (false): !=0 plot region boxes over global maps with thickness = abs(boxregion); white (>0) or grey (<0).
removedesert (false) remove (flag as NA) grid points with mean annual pr < 0.5 mm/day (deserts, Giorgi2014). This affects timeseries and trends calculations too.
Timeseries and trends
weight_tseries (true): adopt area weights in timeseries
trend_years (false): (a) false = apply trend to all years in dataset; (b) [year1, year2] to apply trend calculation and plotting only to a limited time interval
add_trend (true): add linear trend to plot
add_trend_sd (false): add dashed lines of stdev range to timeseries
add_trend_sd_shade (false): add shade of stdev range to timeseries
add_tseries_lines (true): plot lines connecting timeseries points
add_zeroline (true): plot a dashed line at y=0
trend_years_only (false): limit timeseries plotting to the time interval adopted for trend calculation (excluding the normalization period)
scale100years (true): plot trends scaled as 1/100 years
scalepercent (false): plot trends as percent change
Variables#
pr (atmos, daily mean, longitude latitude time)
Additional variables for recipe_hyint_extreme_events.yml
tas (atmos, daily mean, longitude latitude time)
tasmin (atmos, daily mean, longitude latitude time)
tasmax (atmos, daily mean, longitude latitude time)
Observations and reformat scripts#
None.
References#
Giorgi et al., 2014, J. Geophys. Res. Atmos., 119, 11,695–11,708, doi:10.1002/ 2014JD022238
Giorgi et al., 2011, J. Climate 24, 5309-5324, doi:10.1175/2011JCLI3979.1
Example plots#
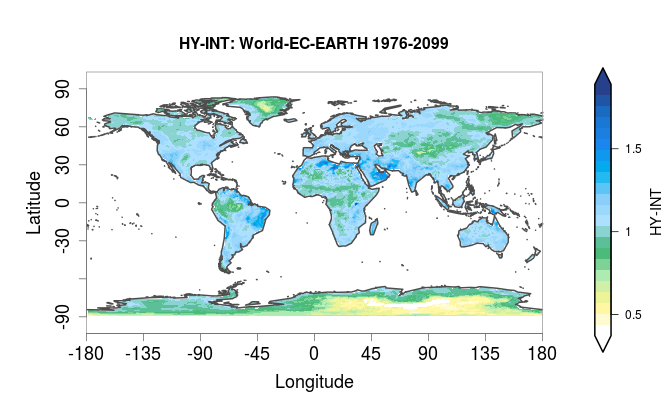
Fig. 176 Mean hydroclimatic intensity for the EC-EARTH model, for the historical + RCP8.5 projection in the period 1976-2099#
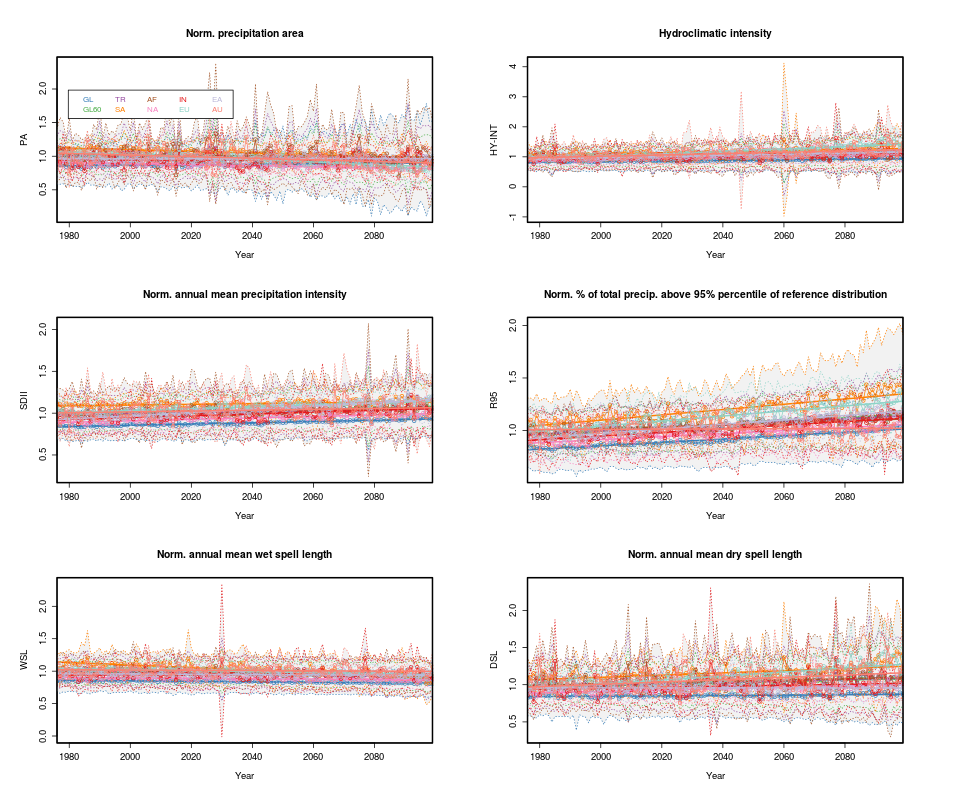
Fig. 177 Timeseries for multiple indices and regions for the ACCESS1-0 model, for the historical + RCP8.5 projection in the period 1976-2099, normalized to the 1976-2005 historical period.#
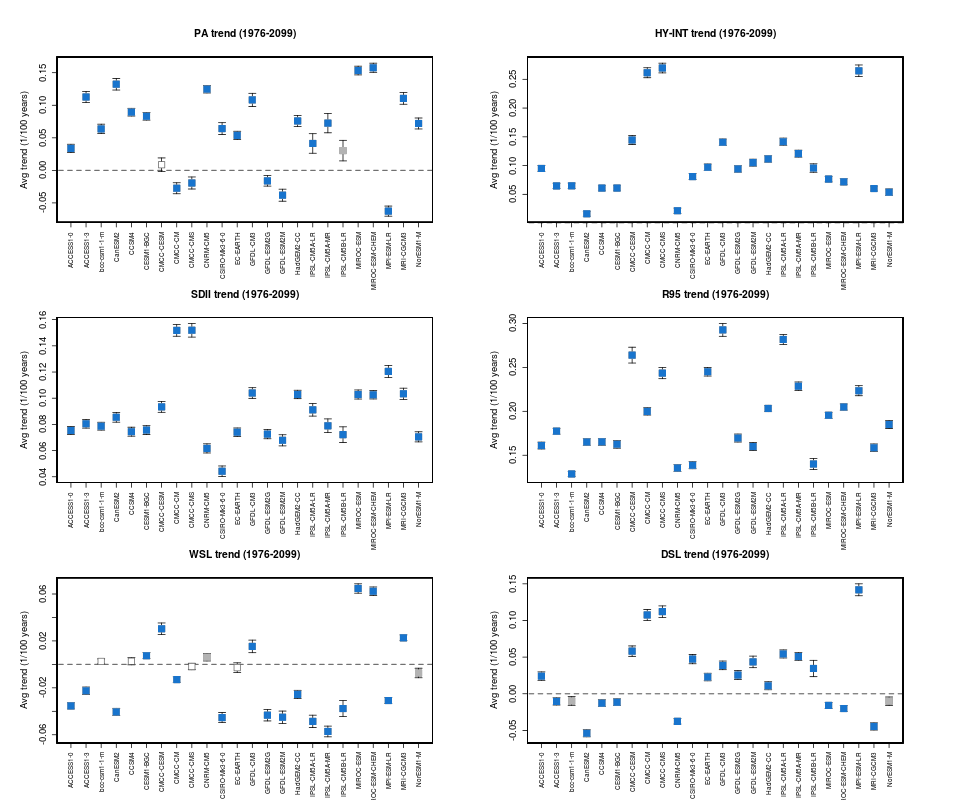
Fig. 178 Multi-model trend coefficients over selected indices for CMIP5 models in the RCP8.5 2006-2099 projection, normalized to the 1976-2005 historical period.#