Standardized Precipitation-Evapotranspiration Index (SPEI)#
Overview#
Droughts can be separated into three main types: meteorological, hydrological, and agricultural drought.
Common for all types is that a drought needs to be put in context of local and seasonal characteristics, i.e. a drought should not be defined with an absolute threshold, but as an anomalous condition.
Meteorological droughts are often described using the standardized precipitation index (SPI; McKee et al, 1993), which in a standardized way describes local precipitation anomalies. It is calculated on monthly mean precipitation, and is therefore not accounting for the intensity of precipitation and the runoff process. Because SPI does not account for evaporation from the ground, it lacks one component of the water fluxes at the surface and is therefore not compatible with the concept of hydrological drought.
A hydrological drought occurs when low water supply becomes evident, especially in streams, reservoirs, and groundwater levels, usually after extended periods of meteorological drought. GCMs normally do not simulate hydrological processes in sufficient detail to give deeper insights into hydrological drought processes. Neither do they properly describe agricultural droughts, when crops become affected by the hydrological drought. However, hydrological drought can be estimated by accounting for evapotranspiration, and thereby estimate the surface retention of water. The standardized precipitation-evapotranspiration index (SPEI; Vicente-Serrano et al., 2010) has been developed to also account for temperature effects on the surface water fluxes. Evapotranspiration is not normally calculated in GCMs, so SPEI often takes other inputs to estimate the evapotranspiration. Here, the Thornthwaite (Thornthwaite, 1948) method based on temperature is applied.
Available recipes and diagnostics#
Recipes are stored in recipes/
recipe_spei.yml
Diagnostics are stored in diag_scripts/droughtindex/
diag_spi.R: calculate the SPI index
diag_spei.R: calculate the SPEI index
User settings#
Script diag_spi.py
Required settings (script)
reference_dataset: dataset_name The reference data set acts as a baseline for calculating model bias.
Script diag_spei.py
Required settings (script)
reference_dataset: dataset_name The reference data set acts as a baseline for calculating model bias.
Variables#
pr (atmos, monthly mean, time latitude longitude)
tas (atmos, monthly mean, time latitude longitude)
References#
McKee, T. B., Doesken, N. J., & Kleist, J. (1993). The relationship of drought frequency and duration to time scales. In Proceedings of the 8th Conference on Applied Climatology (Vol. 17, No. 22, pp. 179-183). Boston, MA: American Meteorological Society.
Vicente-Serrano, S. M., Beguería, S., & López-Moreno, J. I. (2010). A multiscalar drought index sensitive to global warming: the standardized precipitation evapotranspiration index. Journal of climate, 23(7), 1696-1718.
Example plots#
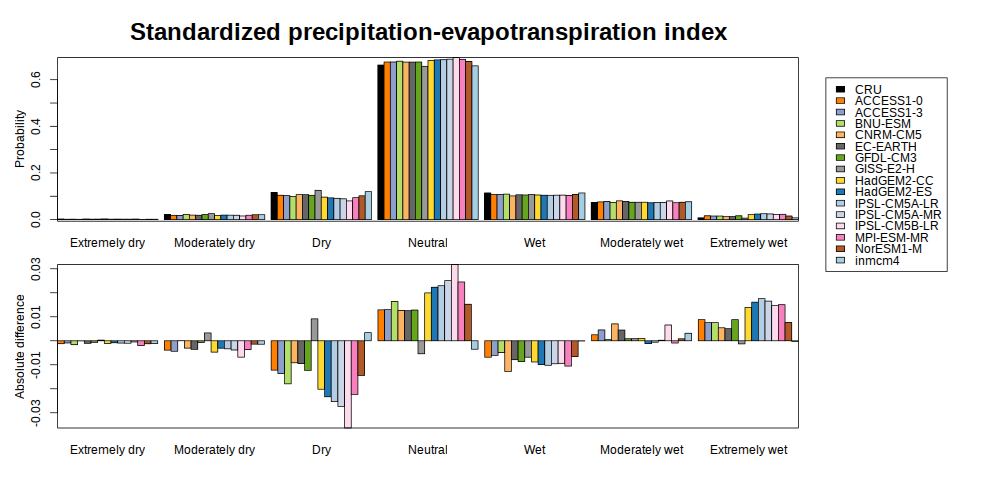
Fig. 56 (top) Probability distribution of the standardized precipitation-evapotranspiration index of a sub-set of the CMIP5 models, and (bottom) bias relative to the CRU reference data set.#
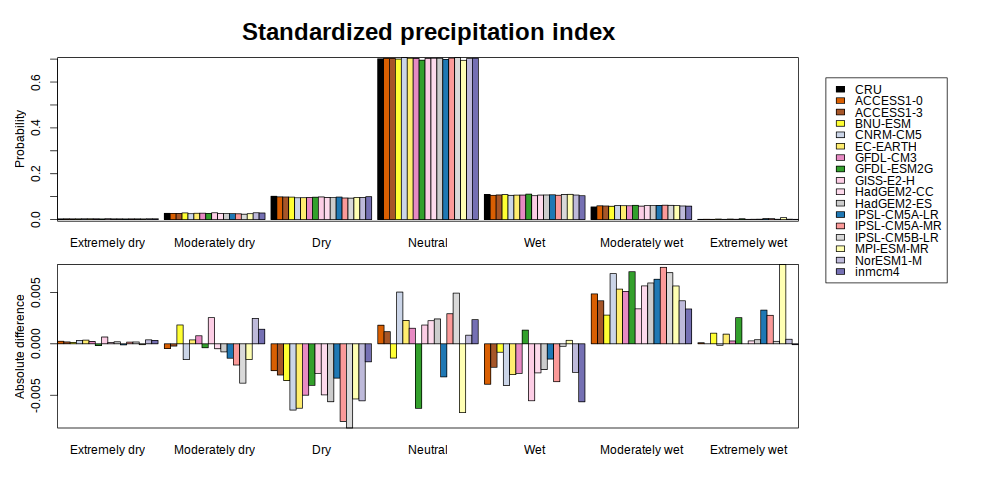
Fig. 57 (top) Probability distribution of the standardized precipitation index of a sub-set of the CMIP5 models, and (bottom) bias relative to the CRU reference data set.#