23. Southern ocean
23.1. Overview
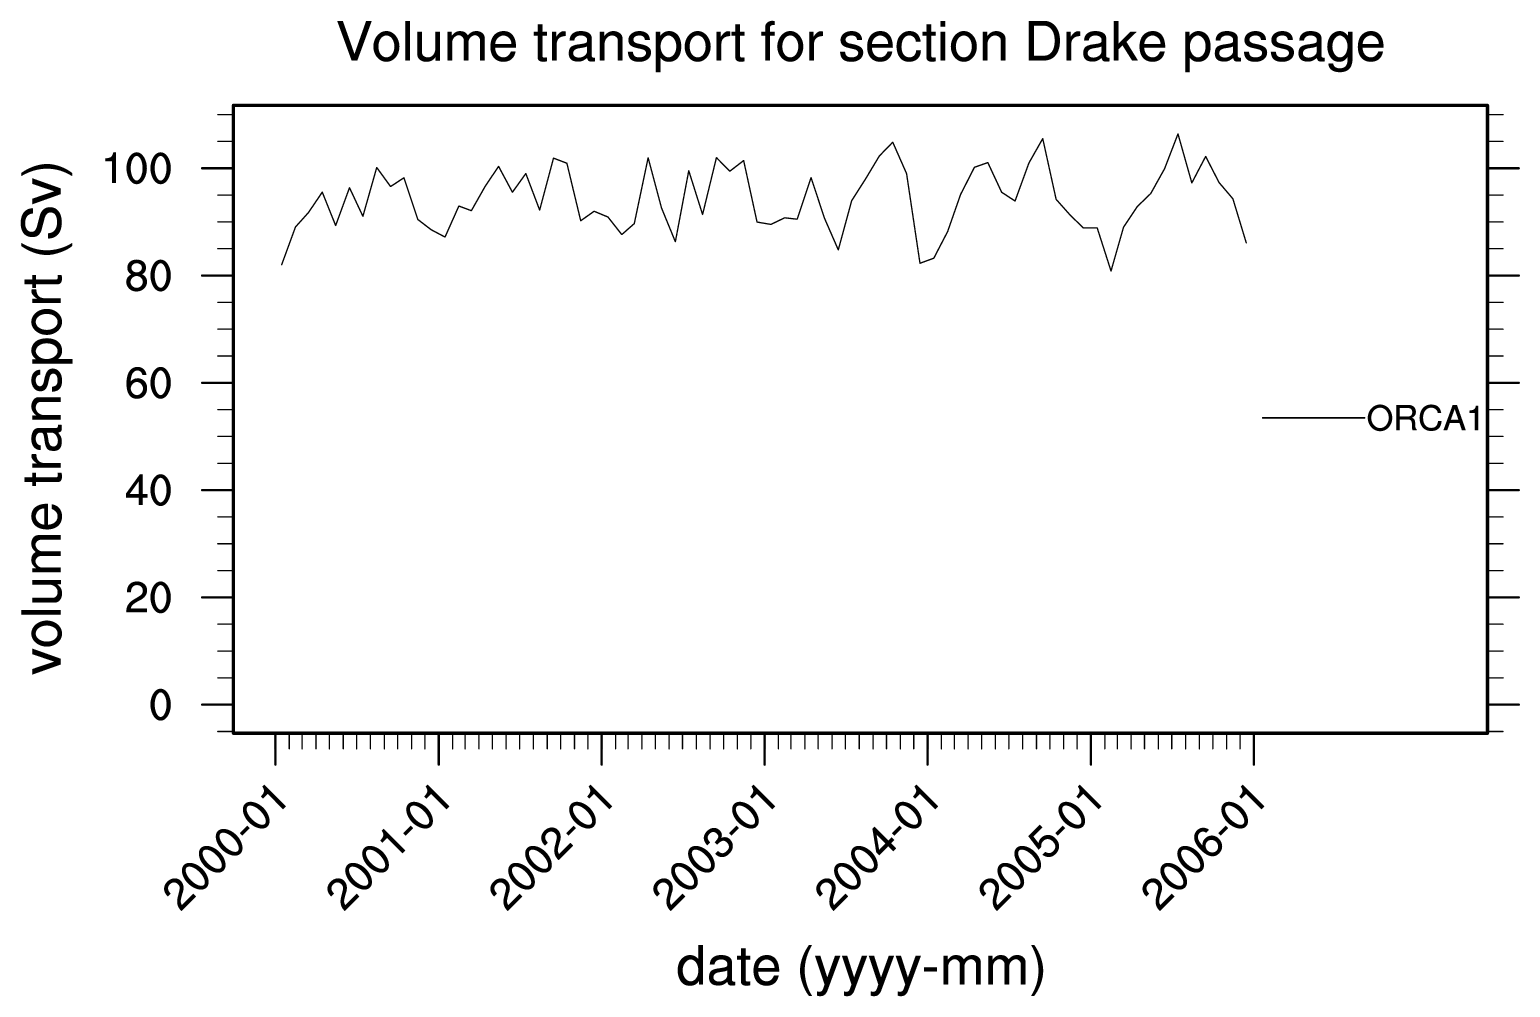
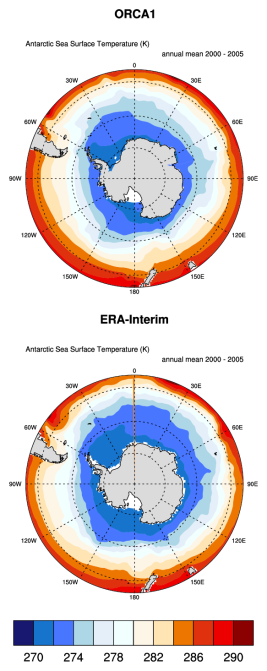
These diagnostics include polar stereographic (difference) maps to compare the monthly/annual mean sea surface temperature, salinity and wind stress from ESMs with ERA-Interim data. Furthermore, there are scripts to plot the differences in the area mean vertical profiles of temperature and salinity between models and data from the World Ocean Atlas (Antonov et al., 2010; Locarnini et al., 2010). The ocean mixed layer thickness from models can be compared with that obtained from the Argo floats (Dong et al., 2008), again using polar stereographic (difference) maps. Finally, the Antarctic Circumpolar Current strength, as measured by water mass transport through the Drake Passage, is calculated using the same method as in the CDFTOOLS package (CDFtools). This diagnostic can be used to calculate the transport through other section as well, but is only available for EC-Earth/NEMO output for which all grid information is available.
23.2. Available namelists and diagnostics
Namelists are stored in nml/
- namelist_SouthernOcean.xml
Diagnostics are stored in diag_scripts/
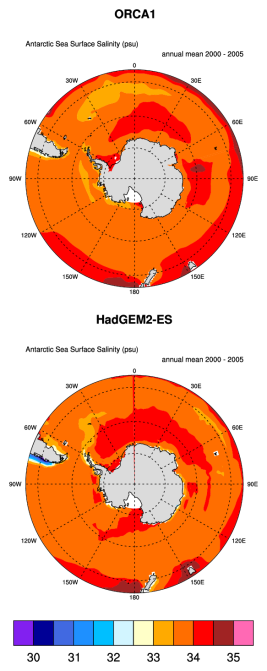
- SouthernOcean_polcon.ncl: create polar stereographic plots for ocean mixed layer thickness, sea surface salinity and sea surface temperature.
- SouthernOcean_polcon_diff.ncl: create polar stereographic plots of the difference between individual models and reference data for ocean mixed layer thickness, sea surface temperature and eastward and northward wind stress. All data are regridded to a common grid using the ESMF regridding software.
- SouthernOcean_vector_polcon_diff.ncl: create polar stereographic contour plots of the difference between individual model data and reference data similar to SouthernOcean_polcon_diff.ncl, but on top plots vectors (magnitude and direction) for both the individual models and the reference data. Currently it is used for wind stress, but it should be possible to use it for other variables with u and v components as well. All data are regridded to a common grid using the ESMF regridding software.
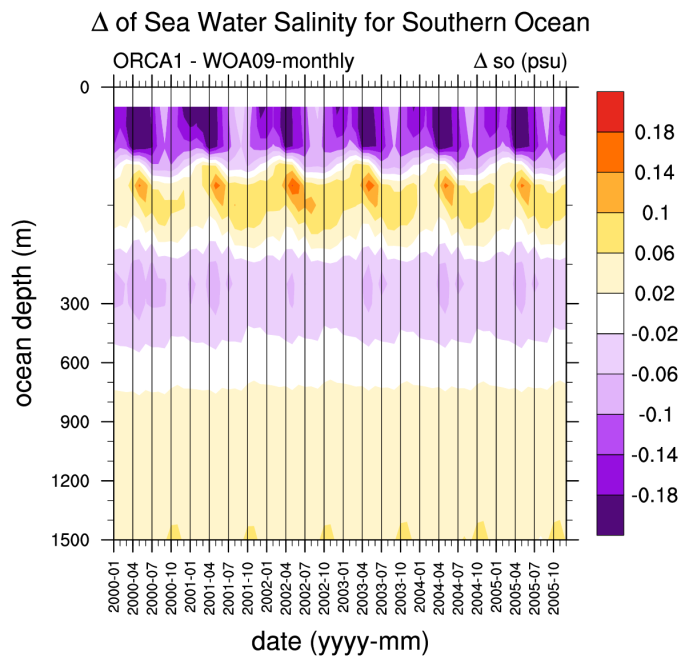
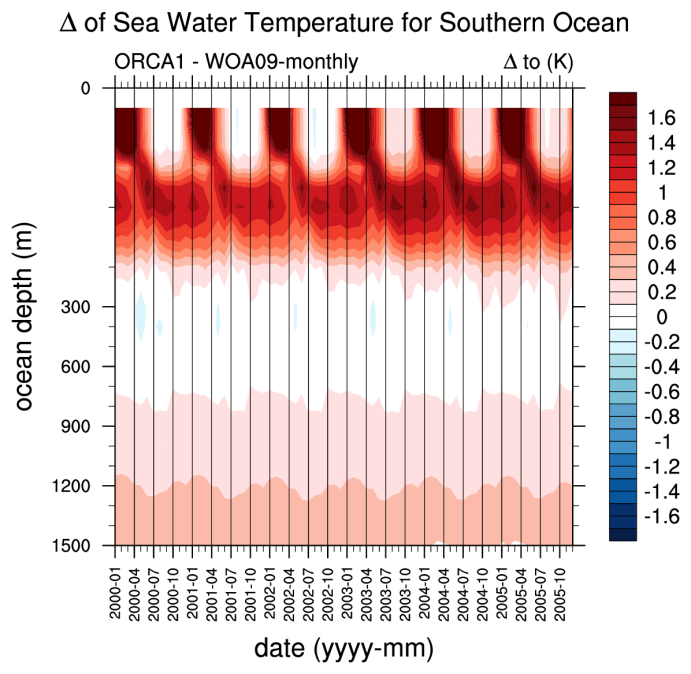
- SouthernOcean_areamean_vertconplot.ncl: calculate the average sea water salinity and temperature over a subdomain from model data and create a Hovmoller-like diagram with time and depth on the axes. All data are regridded to a common grid using the ESMF regridding software.
- SouthernOcean_transport.ncl: calculate the sea water volume transport across a section from the variables uo and vo using a similar approach as is done in the CDFTOOLS package. Currently only available for EC-Earth/Nemo output as the calculations are performed using uo and vo on a staggered grid and the grid dimensions of the u and v grids are required.
23.3. User settings
User setting files (cfg files) are stored in nml/cfg_SouthernOcean/
SouthernOcean_polcon.ncl, SouthernOcean_polcon_diff.ncl, SouthernOcean_vector_polcon_diff.ncl
- region: “Antarctic” (entire hemisphere will be evaluated)
- month: “A” (A = annual mean, 3 = March, 9 = September)
- styleset: “CMIP5”, “DEFAULT”
- max_vert: max. number of rows on a panel page (vertical)
- max_hori: max. number of columns on a panel page (horizontal)
- grid_min: min. contour value (default = -1.0)
- grid_max: max. contour value (default = 1.0)
- grid_step: step between contours (default = 0.2)
- colormap: color table (from NCL distribution)
- PanelLabelBar: use single label bar per page (True, False)
- showunits: display units in figure title (True, False)
- range_option: 0 = use each model’s time range specified in namelist, 1 = use only intersection of all time ranges
Setting specific to SouthernOcean_vector_polcon_diff.ncl
- vcmagnitude: magnitude of vectors (larger value = shorter arrows)
- vcmindist: controls density of vectors (larger value = less arrows)
- vccolormod: color of vectors for current model
- vccolorref: color of vectors for reference model
SouthernOcean_areamean_vertconplot.ncl
Required diag_script_info attributes
- region: name of region (“Southern Ocean”)
- West: western boundary of area
- East: eastern boundary of area
- South: southern boundary of area
- North: northern boundary of area
- styleset: plot style (“CMIP5”, “DEFAULT”)
Optional diag_script_info attributes
- grid_min: min. for plot scale
- grid_max: max. for plot scale
- grid_step: step size for plot scale
- colormap: e.g., WhiteBlueGreenYellowRed, rainbow
- dbg_plots: create additional plots for debugging purposes (True, False)
SouthernOcean_transport.ncl
Required diag_script_info attributes
- styleset: plot style (“CMIP5”, “DEFAULT”)
- lon1: longitude of start of section
- lat1: latitude of start of section
- lon2: longitude of end of section
- lat2: latitude of end of section
- section_name: name used in title, e.g., “Drake passage”
23.4. Variables
- hfds (atmos, monthly mean, longitude latitude time) = hfls + hfss + rsns + rlns
- mlotst (ocean, monthly mean, longitude latitude time)
- so (ocean, monthly mean, longitude latitude olevel time)
- sos (ocean, monthly mean, longitude latitude time)
- tauu (atmos, monthly mean, longitude latitude time)
- tauv (atmos, monthly mean, longitude latitude time)
- to (ocean, monthly mean, longitude latitude olevel time)
- tos (ocean, monthly mean, longitude latitude time)
- uo (ocean, monthly mean, longitude latitude olevel time)
- vo (ocean, monthly mean, longitude latitude olevel time)
- wfpe (atmos, monthly mean, longitude latitude time) = pr + evspsbl
23.5. Observations and reformat scripts
Note: (1) obs4mips data can be used directly without any preprocessing; (2) see headers of reformat scripts for non-obs4mips data for download instructions.
- Dong et al. (2008): Southern Ocean mixed-layer depth from Argo float profiles. Reformat script: reformat_scripts/obs/reformat_obs_Dong08-ARGO-monthly.ncl.
- ERA-Interim, global atmospheric ECMWF reanalysis: SST, wind stress, precipitation, evaporation, etc.
Reformat scripts:
- variables tos, tauu, tauv: reformat_scripts/obs/reformat_obs_ERA-Interim.ncl
- variables pr, evspsbl, hfls, hfss, rsns, rlns: reformat_scripts/obs/reformat_obs_ERA-Interim-surffluxes.ncl
- World Ocean Atlas 2009: sea water temperature and salinity
Reformat script: reformat_scipts/obs/reformat_obs_WOA09.ncl
23.6. References
- Antonov, J. I., D. Seidov, T. P. Boyer, R. A. Locarnini, A. V. Mishonov, H. E. Garcia, O. K. Baranova, M. M. Zweng, and D. R. Johnson (2010). World Ocean Atlas 2009, Volume 2: Salinity. S. Levitus, Ed. NOAA Atlas NESDIS 69, U.S. Government Printing Office, Washington, D.C., 184 pp (available at ftp://ftp.nodc.noaa.gov/pub/WOA09/DOC/woa09_vol2_text.pdf).
- CDFtools: http://servforge.legi.grenoble-inp.fr/projects/CDFTOOLS
- Dong, S., J. Sprintall, S. T. Gille, and L. Talley (2008). Southern Ocean mixed-layer depth from Argo float profiles, J. Geophys. Res., 113, C06013, doi: 10.1029/2006JC004051.
- ERA-Interim: http://www.ecmwf.int/en/research/climate-reanalysis/era-interim
- ESMF regridding with ncl: http://www.ncl.ucar.edu/Applications/ESMF.shtml
- Locarnini, R. A., A. V. Mishonov, J. I. Antonov, T. P. Boyer, H. E. Garcia, O. K. Baranova, M. M. Zweng, and D. R. Johnson (2010). World Ocean Atlas 2009, Volume 1: Temperature. S. Levitus, Ed. NOAA Atlas NESDIS 68, U.S. Government Printing Office, * Washington, D.C., 184 pp. (available at ftp://ftp.nodc.noaa.gov/pub/WOA09/DOC/woa09_vol1_text.pdf).
- nco: http://nco.sourceforge.net
- World Ocean Atlas 2009: https://www.nodc.noaa.gov/OC5/WOA09/pr_woa09.html