19. Precipitation dependence on soil moisture
19.1. Overview
The “precipitacion dependance on soil moisture diagnostic” is used for the analysis of the coupling between soil moisture and precipitation in Taylor et al. 2012. The script sm_pr_diag_nml.py provides the diagnostic on a regular 5°x5° grid for the land surface between 60°S and 60°N. In the output plots (see example Figure 19.1) shading blue (red) indicates convective precipitation more likely over wetter (drier) soils.
19.2. Available namelists and diagnostics
Namelists are stored in nml/
- namelist_sm_pr.xml
Diagnostics are stored in diag_scripts/
- sm_pr_diag_nml.py: this script computes and plot the diagnostic “preference for afternoon precipitation over soil moisture anomalies” as in Fig.3 of Taylor et al. (2012).
19.3. Specific Routines
- main(project_info): call all callable fuctions to read CMIP5 data, compute and plot the diagnostic
- read_pr_sm_topo(project_info): read and extract input for computing the diagnostic from CMIP5 input data and topography from aux file topo_var_5x5.gra
- get_smclim(sm, lon, time): compute monthly soil moisture climatology at 0600 LT (note that more strictly this is between 0600 and 0859 LT)
- get_monthly_input(project_info, mn, time, lon, lat, time_bnds_1, pr, sm, fileout, samplefileout, verbosity): prepare and agregate by month the input data required by the F90 routines global_rain_sm and sample_events
- F90 routine global_rain_sm: identifies rain events (time and location) from 3-hourly rainfall
- F90 routine sample_events: creates two datasets of difference in soil moisture between the locations of rainfall maximum and minimum, dataset 1 is for the events themselves, dataset 2 for the same locations but in different years (i.e. non-events)
- get_p_val(in_dir): compares the statistics of the two datasets above by resampling, to compute percentiles (p_values) of “preference for afternoon precipitation over soil moisture anomalies” as in Fig.3 of Taylor et al. 2012
- write_nc(fileout, xs, ys, p_vals, project_info): save netCDF file with the diagnostic in a regular 5°x5° grid
- plot_diagnostic(fileout, plot_dir, project_info): plot diagnostic and save to .png file
Installation procedure
The diagnostics uses two Fortran programs that have to be compiled and interfaced to Python. This is done via the F2PY - Fortran to Python interface generator. General instructions for this is:
cd diag_scripts
f2py --fcompiler=gfortran -c -m global_rain_sm global_rain_sm.f90
f2py --fcompiler=gfortran -c -m sample_events sample_events.f90
cd ../
<Run diagnostics as usual>
19.4. User settings
User setting files (cfg files) are stored in nml/ cfg_sm_pr/
19.5. Variables
- pr – precipitation (atmos, 3hr, time latitude longtitude)
- mrsos – moisture in upper portion of soil column (land, 3hr, time latitude longtitude)
19.6. Observations and reformat scripts
None.
19.7. References
- Taylor, C. M., R. A. M. de Jeu, F. Guichard, P. P. Harris, and W. A. Dorigo (2012), Afternoon rain more likely over drier soils, Nature, 489(7416), 423-426, doi: 10.1038/nature11377.
19.8. Example plots
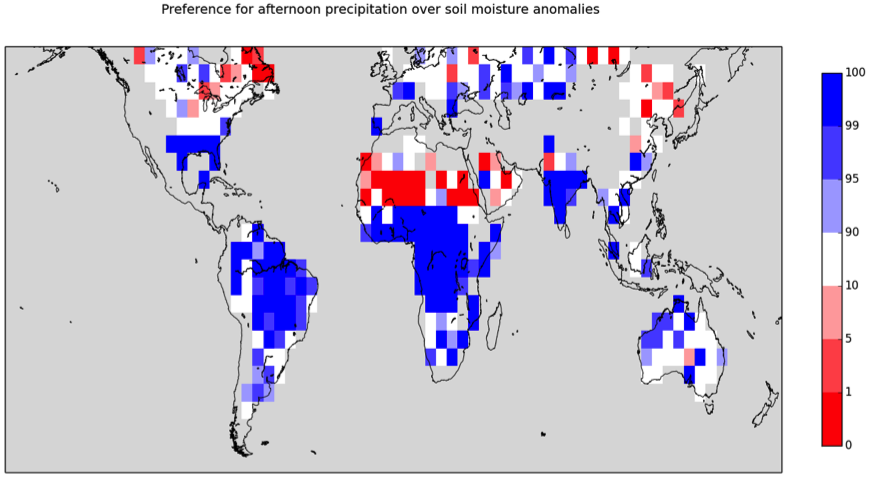
Figure 19.1 CNRM-CM5_sm_pr_diag_plot (CNRM-CM5, 3hr, amip, r1i1p1, 1999-2008).