12. Land and ocean components of the global carbon cycle
12.1. Overview
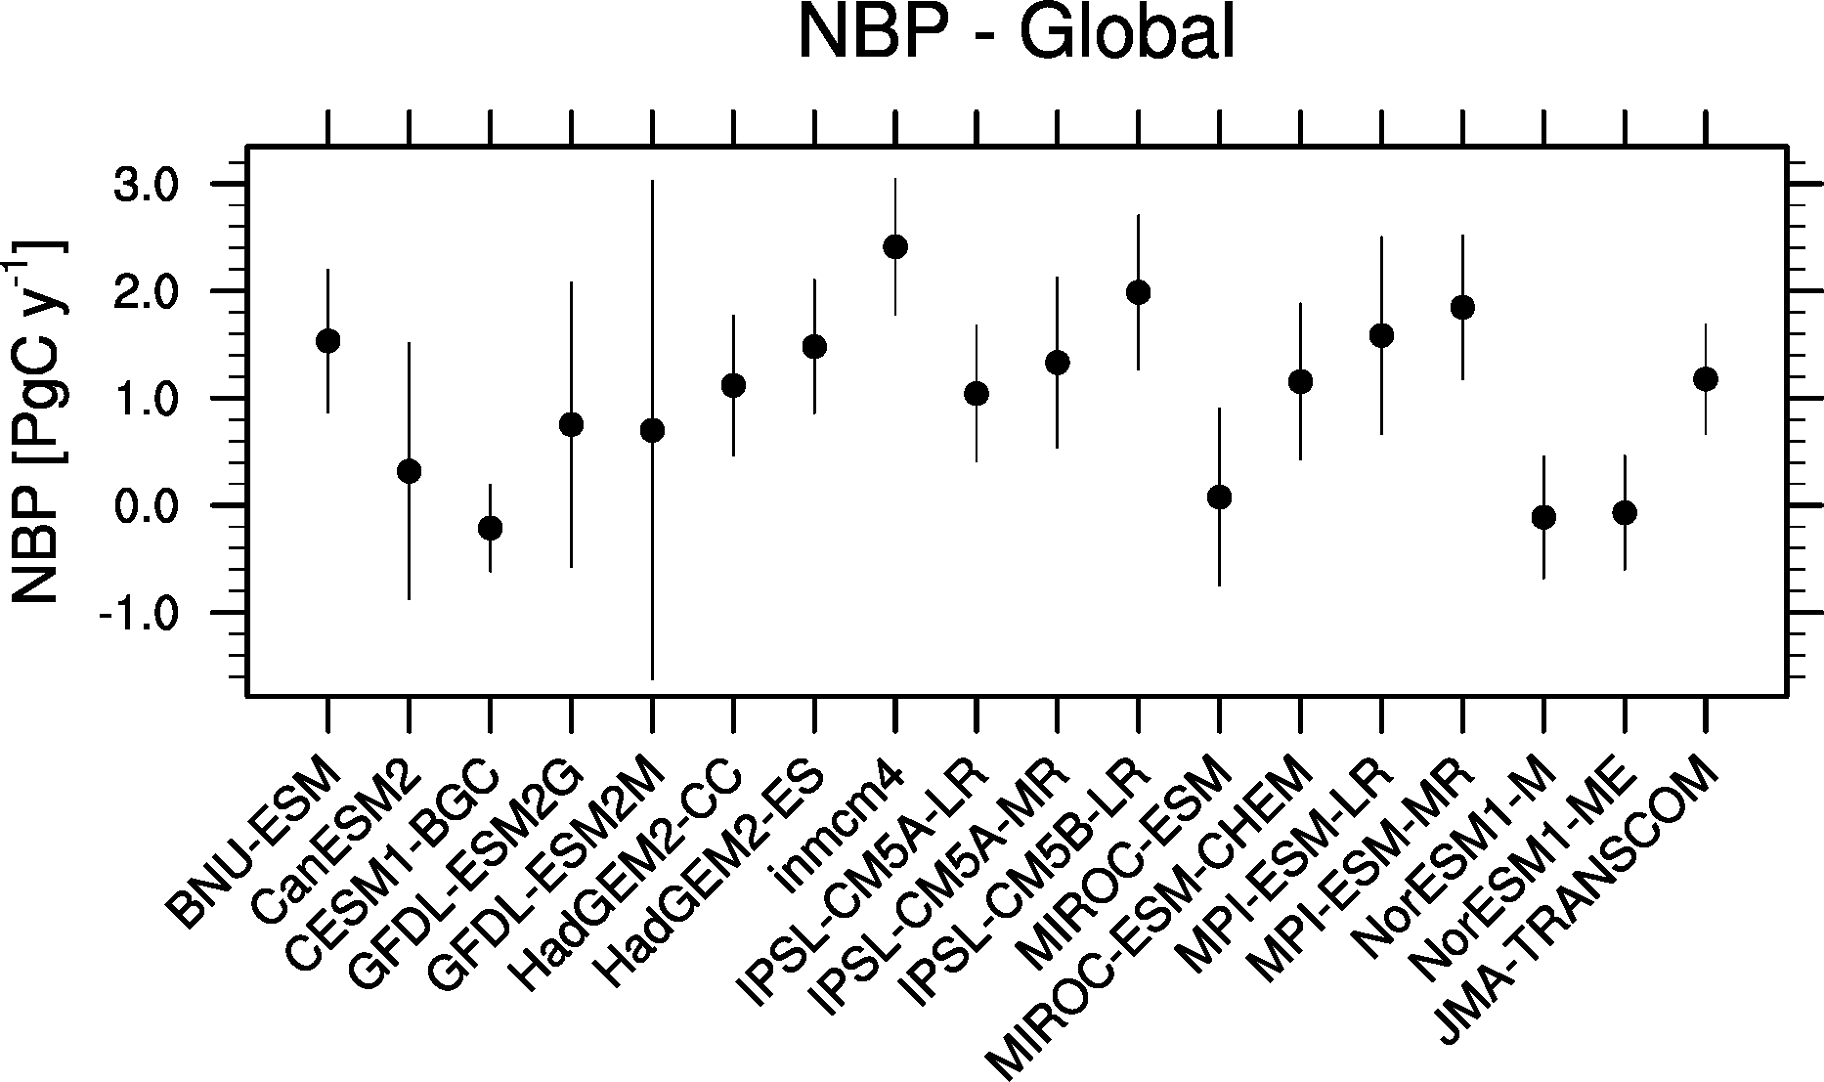
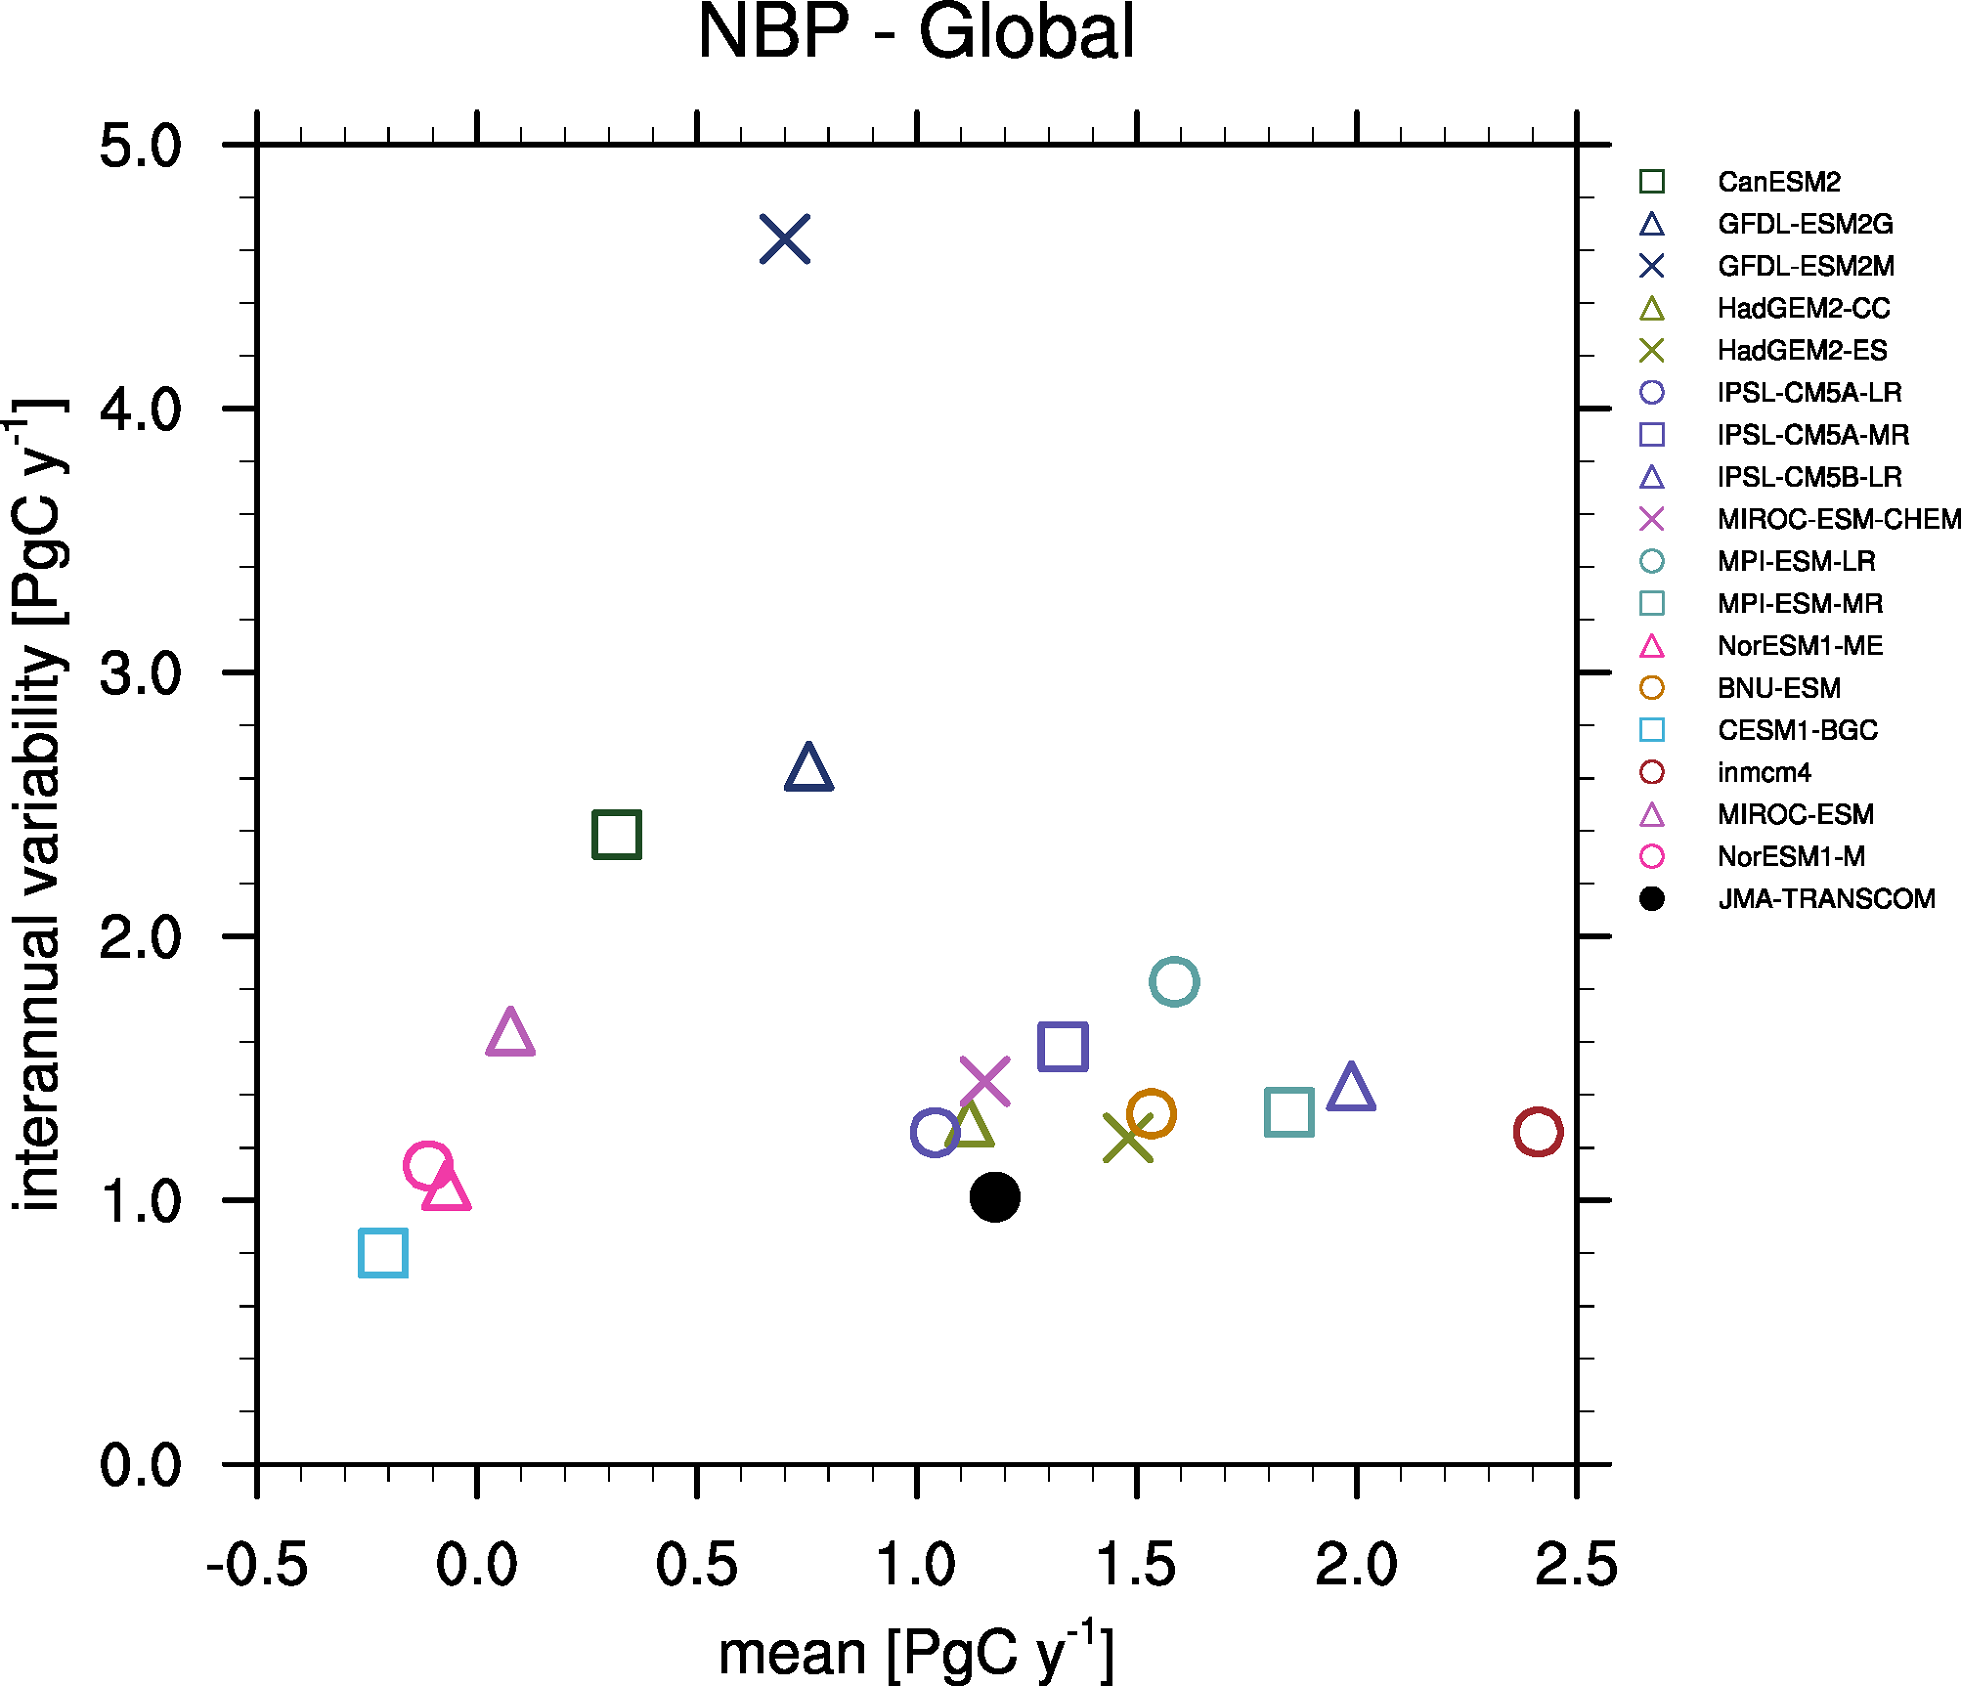
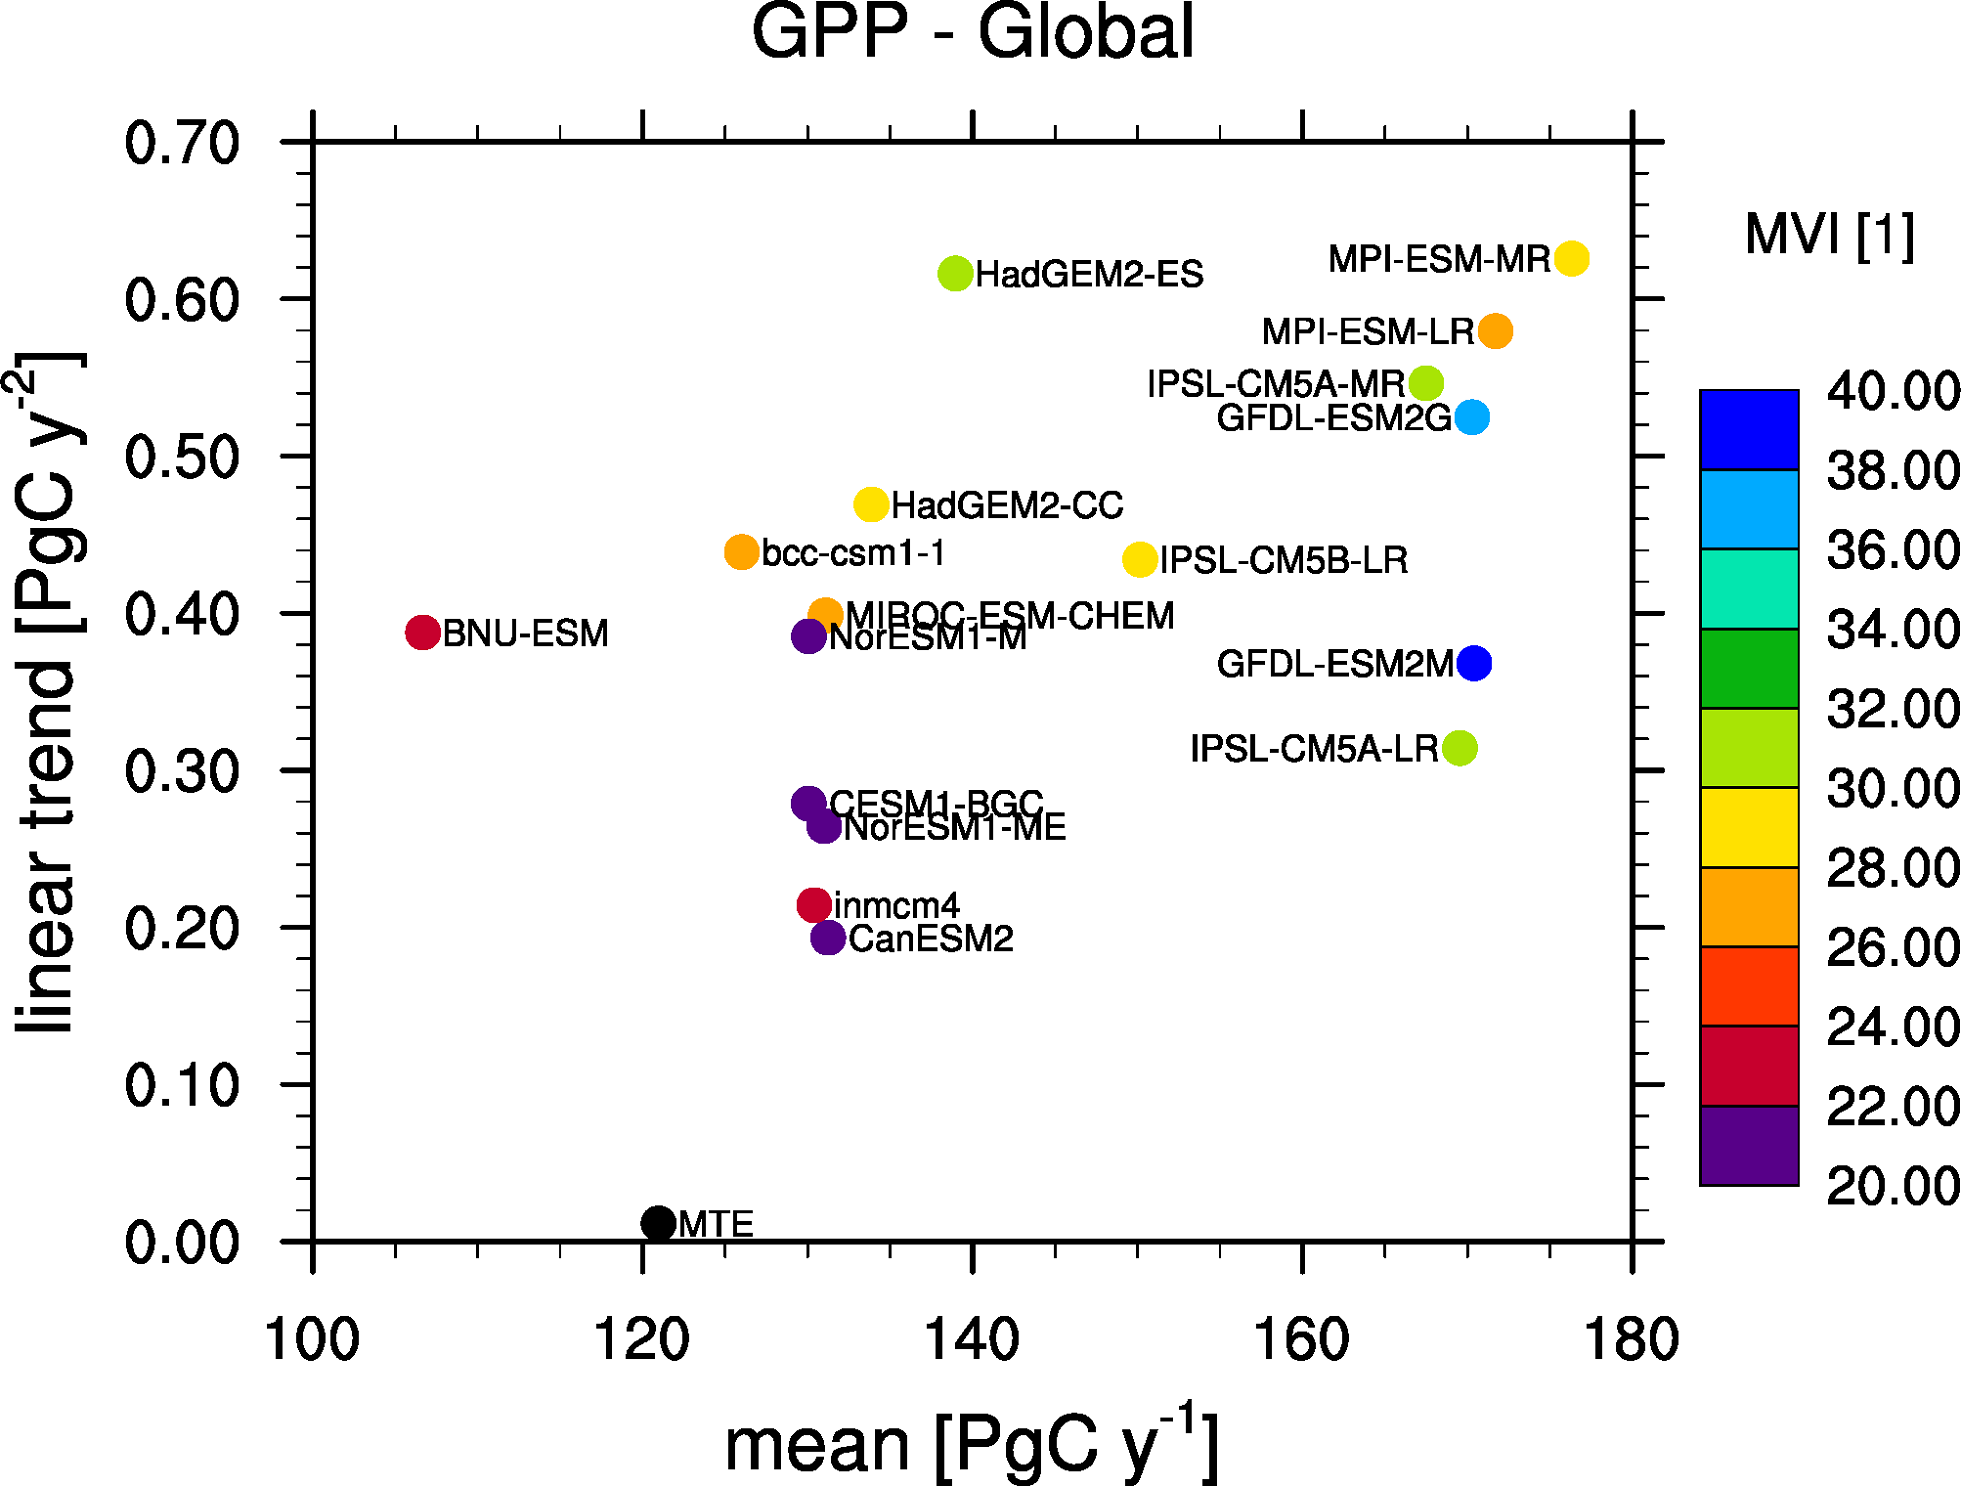
This namelist reproduces most of the figures of Anav et al. (2013):
- seasonal cycle plot for different regions
- errorbar plot for different regions showing mean and standard deviation
- scatterplot for different regions showing mean vs. interannual variability
- 3D-scatterplot for different regions showing mean vs. linear trend and the model variability index (MVI) as a third dimension (color coded)
- scatterplot for different regions comparing two variable against each other (cSoil vs. cVeg)
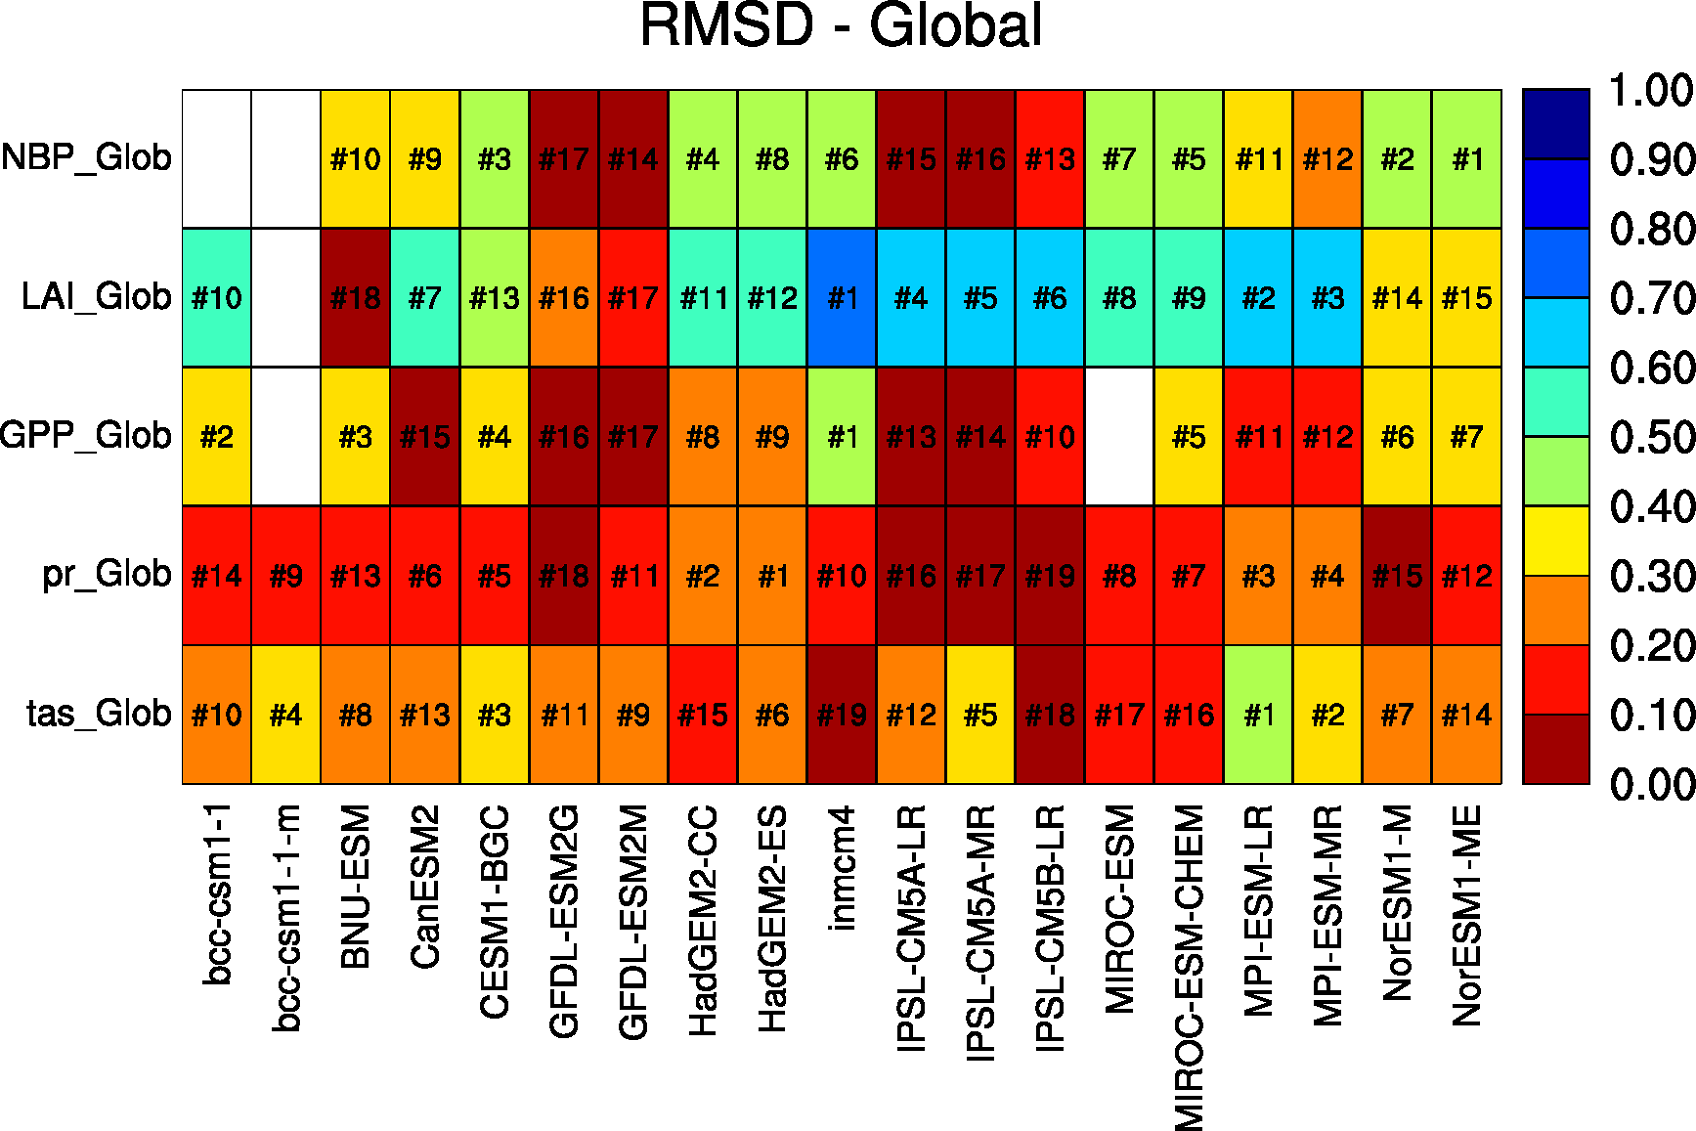
In addition, performance metrics are calculated for all variables using the performance metric diagnostics (see details in section Performance metrics for essential climate parameters). This however applies only to variables on a regular grid (i.e., not to fgco2), as irregular grids are not yet supported by the performance “mwtr”.
12.2. Available namelists and diagnostics
Namelists are stored in nml/
- namelist_anav13jclim.xml
Diagnostics are stored in diag_scripts/
- CarbonCycle_main.ncl: calculate temporal and spatial averages and plots the variable as error-bar and seasonal cycle plots.
- CarbonCycle_MVI.ncl: calculate the model variability index (MVI), interannual variability (IAV) and mean, and draw them in a 3D scatter plot.
- CarbonCycle_2vars.ncl: draw a scatter plot with two variables.
- (perfmetrics_main.ncl): see section Performance metrics for essential climate parameters
- (perfmetrics_grading.ncl): see section Performance metrics for essential climate parameters
12.3. User settings
User setting files (cfg files) are stored in nml/cfg_anav13jclim/
CarbonCycle_MVI.ncl
Diag_script_info attributes
- grid: target grid for regridding (“0.5deg”, “1deg”, “2deg”)
- region: region for spatial average (“Global”, “Northern Hemisphere”, “Southern Hemisphere”, “Tropics”)
- ref_model : reference model, e.g. “CRU”
CarbonCycle_main.ncl
Diag_script_info attributes
- region: region for spatial average (“Global”, “Northern Hemisphere”, “Southern Hemisphere”, “Tropics”)
- legend_outside: plot legend in a separate file (True, False)
- styleset: plot style set (“CMIP5”, “EMAC”, “DEFAULT”)
- sort: sort models alphabetically (True, False)
- seasonal_cycle_plot: create seasonal cycle plot (True, False)
- errorbar_plot: create error bar plot (True, False)
- mean_IAV_plot: create mean (x-axsis), IAV (y-axsis) plot (True, False)
CarbonCycle_2vars.ncl
Diag_script_info attributes
- region: region for spatial average (“Global”, “Northern Hemisphere”, “Southern Hemisphere”, “Tropics”)
- legend_outside: plot legend in a separate file (True, False)
- styleset: plot style set (“CMIP5”, “EMAC”, “DEFAULT”)
perfmetrics_main.ncl, perfmetric_grading.ncl
Diag_script_info attributes
- see Section 18
12.4. Variables
- tas (atmos, monthly mean, longitude latitude time)
- pr (atmos, monthly mean, longitude latitude time)
- nbp (lmon, monthly mean, longitude latitude time)
- gpp (lmon, monthly mean, longitude latitude time)
- lai (lmon, monthly mean, longitude latitude time)
- cVeg (lmon, monthly mean, longitude latitude time)
- cSoil (lmon, monthly mean, longitude latitude time)
- fgco2 (omon, monthly mean, longitude latitude time)
12.5. Observations and reformat scripts
Note: (1) obs4mips data can be used directly without any preprocessing; (2) see headers of reformat scripts for non-obs4mips data for download instructions.
CRU (near-sruface air temperature, precipitation)
Reformat script: reformat_scripts/obs/reformat_obs_CRU.ncl
MTE (gross primary productivity of carbon)
LAI3g (leaf area index)
JMA-TRANSCOM (CO2 exchange)
HSWD (soil carbon content)
NDP (vegetation carbon content)
Reformat scripts: The reformat scripts for the following data sets could not be included in the ESMValTool v1.1: MTE, LAI3g, JMA-TRANSCOM, HSWD, and NDP. Please contact the author of this diagnostic package (A. Anav) for obtaining the reformat scripts.
12.6. References
- Anav, A. et al.: Evaluating the land and ocean components of the global carbon cycle in the CMIP5 Earth System Models, J. Climate, 26, 6901-6843, doi: 10.1175/JCLI-D-12-00417.1, 2013.