Stratosphere-troposphere coupling and annular modes indices (ZMNAM)
Overview
The current generation of climate models include the representation of stratospheric processes, as the vertical coupling with the troposphere is important for the weather and climate at the surface (e.g., Baldwin and Dunkerton, 2001).
The recipe recipe_zmnam.yml can be used to evaluate the representation of Annular Modes (AM, e.g., Wallace, 2000) in climate simulations, using reanalysis datasets as reference.
The calculation is based on the “zonal mean algorithm” of Baldwin and Thompson (2009), and is alternative to pressure based or height-dependent methods.
This approach provides a robust description of the stratosphere-troposphere coupling on daily timescales, requiring less subjective choices and a reduced amount of input data. Starting from daily mean geopotential height on pressure levels, the leading empirical orthogonal function/principal component are computed from zonal mean daily anomalies, with the leading principal component representing the zonal mean AM index. The regression of the monthly mean geopotential height onto this monthly averaged index represents the AM pattern for each selected pressure level.
The outputs of the procedure are the monthly time series and the histogram of the daily zonal mean AM index, and the monthly regression maps for selected pressure levels. The users can select the specific datasets (climate model simulation and/or reanalysis) to be evaluated, the Northern or Southern hemisphere (NH or SH) and a subset of pressure levels of interest.
Available recipes and diagnostics
Recipes are stored in recipes/
recipe_zmnam.yml
Diagnostics are stored in diag_scripts/zmnam/
zmnam.py
and subroutines
zmnam_calc.py
zmnam_plot.py
zmnam_preproc.py
User settings
Hemisphere of interest (NH or SH)
Variables
zg (atmos, daily mean, longitude latitude time)
Observations and reformat scripts
None.
References
Baldwin, M. P. and Thompson, D. W. (2009), A critical comparison of stratosphere–troposphere coupling indices. Q.J.R. Meteorol. Soc., 135: 1661-1672. doi:10.1002/qj.479.
Baldwin, M. P and Dunkerton, T. J. (2001), Stratospheric Harbingers of Anomalous Weather Regimes. Science 294 (5542): 581-584. doi:10.1126/science.1063315.
Wallace, J. M. (2000), North Atlantic Oscillation/annular mode: Two paradigms-one phenomenon. Q.J.R. Meteorol. Soc., 126 (564): 791-805. doi:10.1002/qj.49712656402.
Example plots
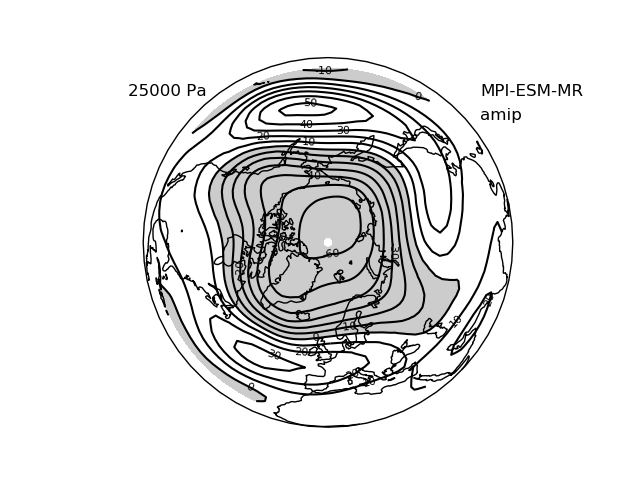
Fig. 58 Regression map of the Northern Hemisphere zonal mean AM index onto geopotential height, for a selected pressure level (250 hPa) for the MPI-ESM-MR model (CMIP5 AMIP experiment, period 1979-2008). Negative values are shaded in grey.
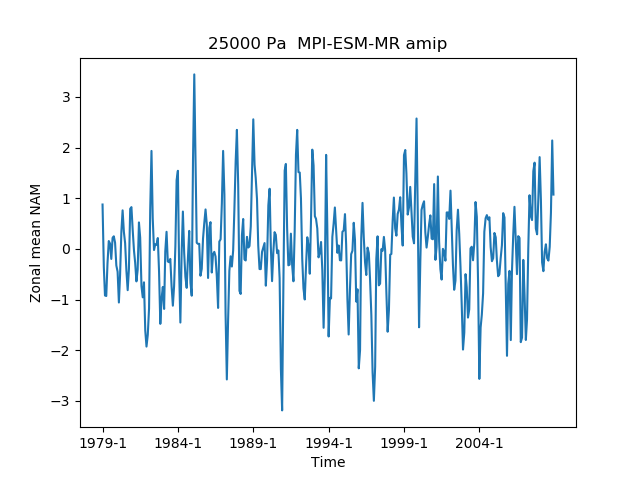
Fig. 59 Time series of the Northern Hemisphere zonal mean AM index for a selected pressure level (250 hPa) for the MPI-ESM-MR model (CMIP5 AMIP experiment, period 1979-2008).