Combined Climate Extreme Index
Overview
The goal of this diagnostic is to compute time series of a number of extreme events: heatwave, coldwave, heavy precipitation, drought and high wind. Then, the user can combine these different components (with or without weights). The result is an index similar to the Climate Extremes Index (CEI; Karl et al., 1996), the modified CEI (mCEI; Gleason et al., 2008) or the Actuaries Climate Index (ACI; American Academy of Actuaries, 2018). The output consists of a netcdf file containing the area-weighted and multi-model multi-metric index. This recipe can be applied to data with any temporal resolution, and the running average is computed based on the user-defined window length (e.g. a window length of 5 would compute the 5-day running mean when applied to data, or 5-month running mean when applied to monthly data).
In recipe_extreme_index.yml, after defining the area and reference and projection period, the weigths for each metric selected. The options are
weight_t90p the weight of the number of days when the maximum temperature exceeds the 90th percentile,
weight_t10p the weight of the number of days when the minimum temperature falls below the 10th percentile,
weight_Wx the weight of the number of days when wind power (third power of wind speed) exceeds the 90th percentile,
weight_cdd the weight of the maximum length of a dry spell, defined as the maximum number of consecutive days when the daily precipitation is lower than 1 mm, and
weight_rx5day the weight of the maximum precipitation accumulated during 5 consecutive days.
Available recipes and diagnostics
Recipes are stored in recipes/
recipe_extreme_index.yml
Diagnostics are stored in diag_scripts/magic_bsc/
extreme_index.R
User settings
User setting files are stored in recipes/
recipe_extreme_index.yml
Required settings for script
weight_t90p: 0.2 (from 0 to 1, the total sum of the weight should be 1)
weight_t10p: 0.2 (from 0 to 1, the total sum of the weight should be 1)
weight_Wx: 0.2 (from 0 to 1, the total sum of the weight should be 1)
weight_rx5day: 0.2 (from 0 to 1, the total sum of the weight should be 1)
weight_cdd: 0.2 (from 0 to 1, the total sum of the weight should be 1)
running_mean: 5 (depends on the length of the future projection period selected, but recommended not greater than 11)
Variables
tasmax (atmos, daily, longitude, latitude, time)
tasmin (atmos, daily, longitude, latitude, time)
sfcWind (atmos, daily, longitude, latitude, time)
pr (atmos, daily, longitude, latitude, time)
Observations and reformat scripts
None
References
Alexander L.V. and Coauthors (2006). Global observed changes in daily climate extremes of temperature and precipitation. J. Geophys. Res., 111, D05109. https://doi.org/10.1029/2005JD006290
American Academy of Actuaries, Canadian Institute of Actuaries, Casualty Actuarial Society and Society of Actuaries. Actuaries Climate Index. http://actuariesclimateindex.org (2018-10-06).
Donat, M., and Coauthors (2013). Updated analyses of temperature and precipitation extreme indices since the beginning of the twentieth century: The HadEX2 dataset. J. Geophys. Res., 118, 2098–2118, https://doi.org/10.1002/jgrd.50150.
Fouillet, A., Rey, G., Laurent, F., Pavillon, G. Bellec, S., Guihenneuc-Jouyaux, C., Clavel J., Jougla, E. and Hémon, D. (2006) Excess mortality related to the August 2003 heat wave in France. Int. Arch. Occup. Environ. Health, 80, 16–24. https://doi.org/10.1007/s00420-006-0089-4
Gleason, K.L., J.H. Lawrimore, D.H. Levinson, T.R. Karl, and D.J. Karoly (2008). A Revised U.S. Climate Extremes Index. J. Climate, 21, 2124-2137 https://doi.org/10.1175/2007JCLI1883.1
Meehl, G. A., and Coauthors (2000). An introduction to trends inextreme weather and climate events: Observations, socio-economic impacts, terrestrial ecological impacts, and model projections. Bull. Amer. Meteor. Soc., 81, 413–416. doi: 10.1175/1520-0477(2000)081<0413:AITTIE>2.3.CO;2
Whitman, S., G. Good, E. R. Donoghue, N. Benbow, W. Y. Shou and S. X. Mou (1997). Mortality in Chicago attributed to the July 1995 heat wave. Amer. J. Public Health, 87, 1515–1518. https://doi.org/10.2105/AJPH.87.9.1515
Zhang, Y., M. Nitschke, and P. Bi (2013). Risk factors for direct heat-related hospitalization during the 2009 Adelaide heat-wave: A case crossover study. Sci. Total Environ., 442, 1–5. https://doi.org/10.1016/j.scitotenv.2012.10.042
Zhang, X. , Alexander, L. , Hegerl, G. C., Jones, P. , Tank, A. K., Peterson, T. C., Trewin, B. and Zwiers, F. W. (2011). Indices for monitoring changes in extremes based on daily temperature and precipitation data. WIREs Clim Change, 2: 851-870. doi:10.1002/wcc.147. https://doi.org/10.1002/wcc.147
Example plots
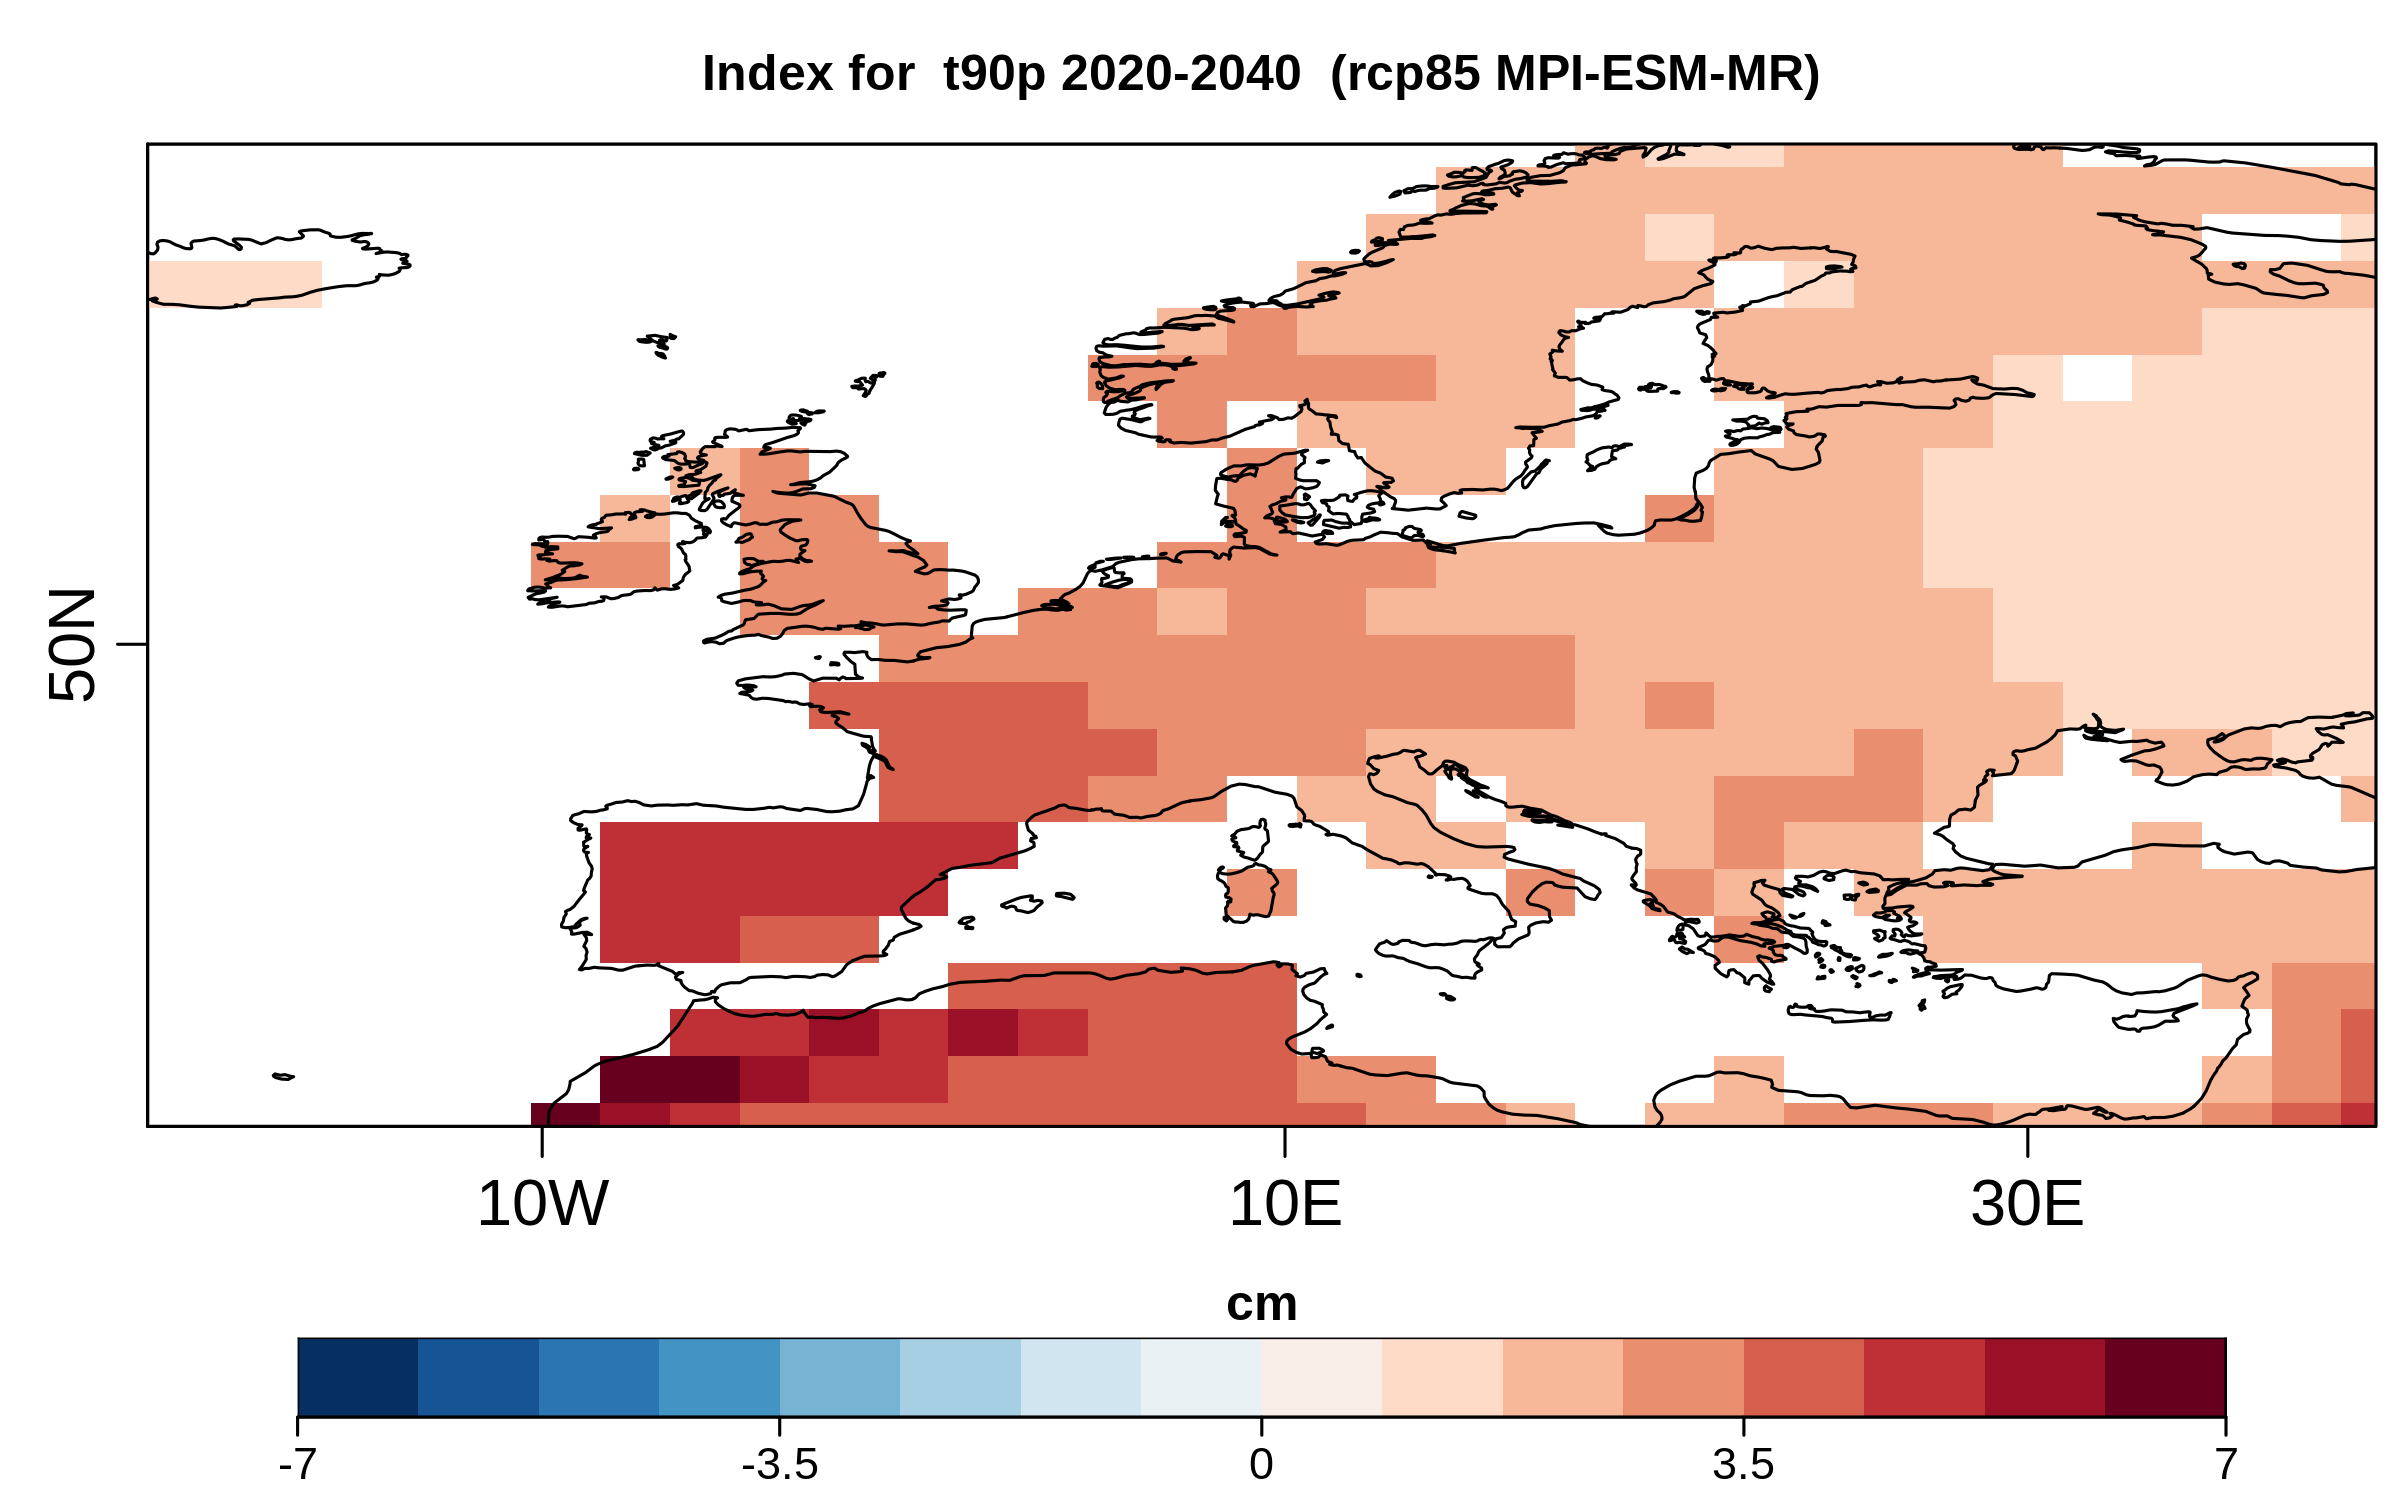
Average change in the heat component (t90p metric) of the Combined Climate Extreme Index for the 2020-2040 compared to the 1971-2000 reference period for the RCP 8.5 scenario simulated by MPI-ESM-MR.