Drought characteristics following Martin (2018)
Overview
Following Martin (2018) drought characteristics are calculated based on the standard precipitation index (SPI), see Mckee et al. (1993). These characteristics are frequency, average duration, SPI index and severity index of drought events.
Available recipes and diagnostics
Recipes are stored in recipes/
recipe_martin18grl.yml
Diagnostics are stored in diag_scripts/
droughtindex/diag_save_spi.R
droughtindex/collect_drought_obs_multi.py
droughtindex/collect_drought_model.py
droughtindex/collect_drought_func.py
User settings in recipe
The recipe can be run with different CMIP5 and CMIP6 models and one observational or reanalysis data set.
The droughtindex/diag_save_spi.R script calculates the SPI index for any given time series. It is based on droughtindex/diag_spi.R but saves the SPI index and does not plot the histogram. The distribution and the representative time scale (smooth_month) can be set by the user, the values used in Martin (2018) are smooth_month: 6 and distribution: ‘Gamma’ for SPI.
There are two python diagnostics, which can use the SPI data to calculate the drought characteristics (frequency, average duration, SPI index and severity index of drought events) based on Martin (2018):
To compare these characteristics between model data and observations or renanalysis data use droughtindex/collect_drought_obs_multi.py Here, the user can set: * indexname: Necessary to identify data produced by droughtindex/diag_save_spi.R as well as write captions and filenames. At the moment only indexname: ‘SPI’ is supported. * threshold: Threshold for this index below which an event is considered to be a drought, the setting for SPI should be usually threshold: -2.0 but any other value will be accepted. Values should not be < - 3.0 or > 3.0 for SPI (else it will identify none/always drought conditions).
To compare these ccharacteristics between different time periods in model data use droughtindex/collect_drought_model.py Here, the user can set: * indexname: Necessary to identify data produced by droughtindex/diag_save_spi.R as well as write captions and filenames. At the moment only indexname: ‘SPI’ is supported. * threshold: Threshold for this index below which an event is considered to be a drought, the setting for SPI should be usually threshold: -2.0 but any other value will be accepted. Values should not be < - 3.0 or > 3.0 for SPI (else it will identify none/always drought conditions). * start_year: Needs to be equal or larger than the start_year for droughtindex/diag_save_spi.R. * end_year: Needs to be equal or smaller than the end_year for droughtindex/diag_save_spi.R. * comparison_period: should be < (end_year - start_year)/2 to have non overlapping time series in the comparison.
The third diagnostic droughtindex/collect_drought_func.py contains functions both ones above use.
Variables
pr (atmos, monthly, longitude, latitude, time)
Observations and reformat scripts
None
References
Martin, E.R. (2018). Future Projections of Global Pluvial and Drought Event Characteristics. Geophysical Research Letters, 45, 11913-11920.
McKee, T. B., Doesken, N. J., & Kleist, J. (1993). The relationship of drought frequency and duration to time scales. In Proceedings of the 8th Conference on Applied Climatology (Vol. 17, No. 22, pp. 179-183). Boston, MA: American Meteorological Society.
Example plots
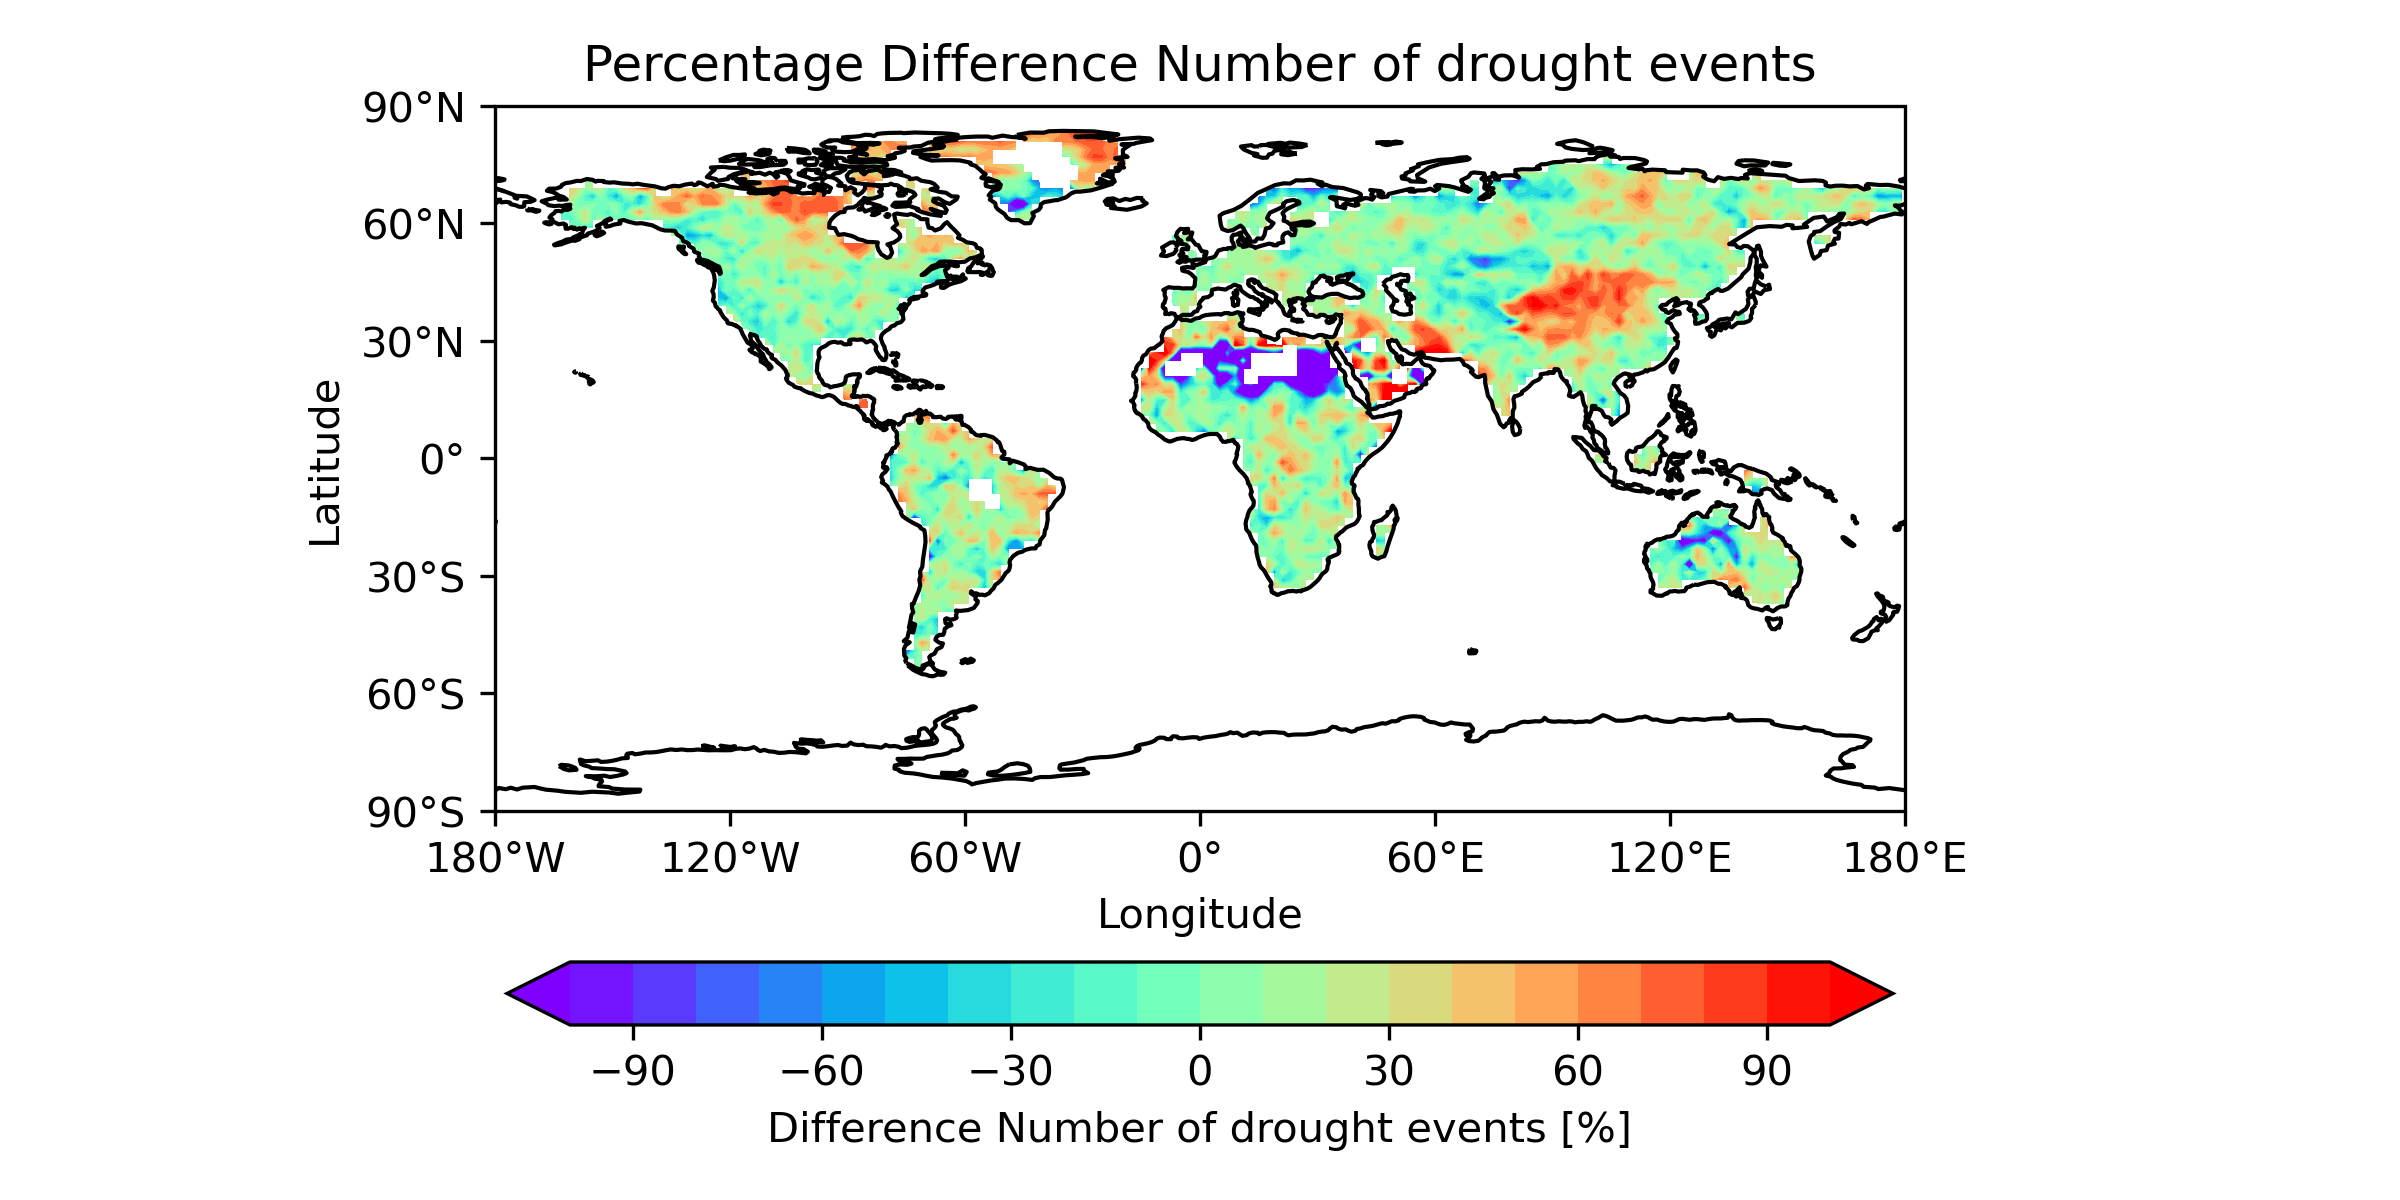
Fig. 44 Global map of the percentage difference between multi-model mean of 15 CMIP models and the CRU data for the number of drought events [%] based on SPI.
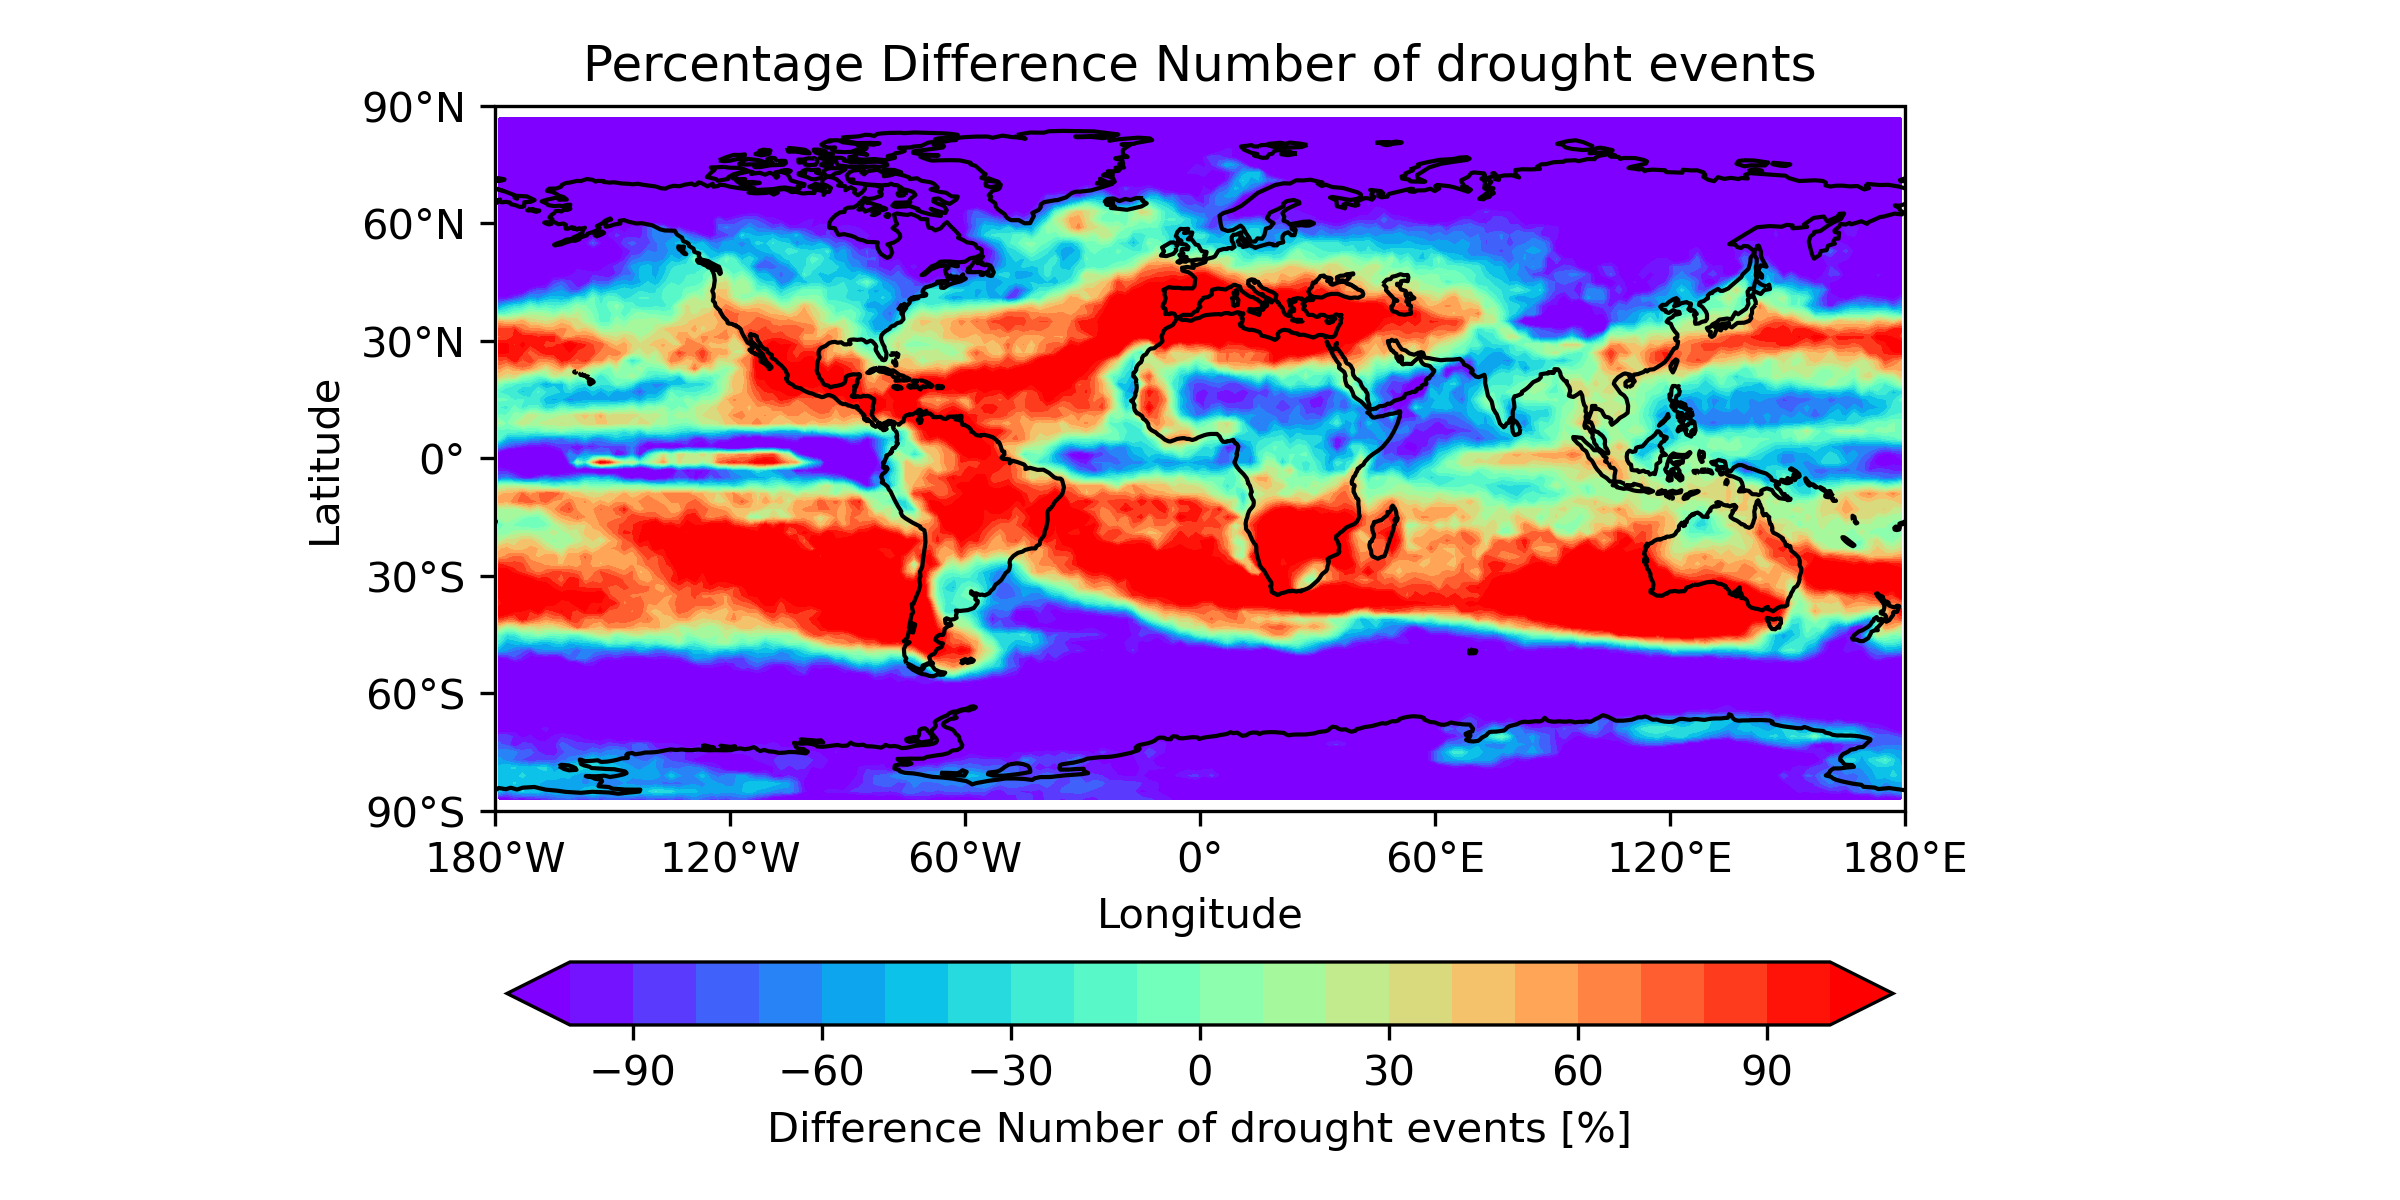
Fig. 45 Global map of the percentage difference between multi-model mean for RCP8.5 scenarios (2050-2100) runs and historical data (1950-2000) for 15 CMIP models for the number of drought events [%] based on SPI.