Extreme Events Indices (ETCCDI)
Overview
This diagnostic uses the standard climdex.pcic.ncdf R library to compute the 27 climate change indices specified by the joint CCl/CLIVAR/JCOMM Expert Team (ET) on Climate Change Detection and Indices http://etccdi.pacificclimate.org/. The needed input fields are daily average precipitation flux and minimum, maximum and average daily surface temperatures. The recipe reproduces panels of figure 9.37 of the IPCC AR5 report, producing both a Gleckler plot, with relative error metrics for the CMIP5 temperature and precipitation extreme indices, and timeseries plots comparing the ensemble spread with observations. For plotting 1 to 4 observational reference datasets are supported. If no observational reference datasets are given, the plotting routines do not work, however, index generation without plotting is still possible. All datasets are regridded to a common grid and considered only over land.
Available recipes and diagnostics
Recipes are stored in recipes/
recipe_extreme_events.yml
Diagnostics are stored in diag_scripts/extreme_events/
ExtremeEvents.r
and subroutines
common_climdex_preprocessing_for_plots.r
make_Glecker_plot2.r
make_timeseries_plot.r
cfg_climdex.r
cfg_extreme.r
User settings
Required settings for script
reference_datasets: list containing the reference datasets to compare with
timeseries_idx: list of indices to compute for timeseries plot. The syntax is “XXXETCCDI_TT”, where “TT” can be either “yr” or “mon” (yearly or monthly indices are computed) and “XXX” can be one of the following: “altcdd”, “altcsdi”, “altcwd”, “altwsdi”, “cdd”, “csdi”, “cwd”, “dtr”, “fd”, “gsl”, “id”, “prcptot”, “r10mm”, “r1mm”, “r20mm”, “r95p”, “r99p”, “rx1day”, “rx5day”, “sdii”, “su”, “tn10p”, “tn90p”, “tnn”, “tnx”, “tr”, “tx10p”, “tx90p”, “txn”, “txx”, “wsdi”. The option “mon” for “TT” can be only used in combination with one of: “txx”, “tnx”, “txn”, “tnn”, tn10p”, “tx10p”, “tn90p”, “tx90p”, “dtr”, “rx1day”, “rx5day”.
gleckler_idx: list of indices to compute for Gleckler plot. Same syntax as above. The diagnostic computes all unique indices specified in either
gleckler_idxortimeseries_idx. If at least one “mon” index is selected, the indices are computed but no plots are produced.base_range: a list of two years to specify the range to be used as “base range” for climdex (the period in which for example reference percentiles are computed)
Optional settings for script
regrid_dataset: name of dataset to be used as common target for regridding. If missing the first reference dataset is used
mip_name: string containing the name of the model ensemble, used for titles and labels in the plots (default: “CMIP”)
analysis_range: a list of two years to specify the range to be used for the analysis in the plots. The input data will need to cover both
analysis_rangeandbase_range. If missing the full period covered by the input datasets will be used.ts_plt: (logical) if to produce the timeseries or not (default: true)
glc_plt: (logical) if to produce the Gleckler or not (default: true)
climdex_parallel: number of parallel threads to be used for climdex calculation (default: 4). Also the logical
falsecan be passed to switch off parallel computation.normalize: (logical) if to detrend and normalize with the standard deviation for the datasets for use in the timeseries plot. When this option is used the data for the following indices are detrended and normalized in the timeseries plots: “altcdd”, “altcsdi”, “altcwd”, “altwsdi”, “cdd”, “cwd”,”dtr”, “fd”, “gsl”, “id”, “prcptot”, “r10mm”, “r1mm”, “r20mm”, “r95p”, “r99p”, “rx1day”, “rx5day”, “sdii”, “su”, “tnn”, “tnx”, “tr”, “txn”,”txn”,”txx” (default: false)
Additional optional setting controlling the plots:
Timeseries plots:
ts_png_width: width for png figures (dafult: 640)
ts_png_height: height for png figures (default: 480)
ts_png_units: units for figure size (default: “px”)
ts_png_pointsize: fontsize (default: 12)
ts_png_bg: background color (default: “white”)
ts_col_list: list of colors for lines (default: [“dodgerblue2”, “darkgreen”, “firebrick2”, “darkorchid”, “aquamarine3”]``)
ts_lty_list: list of linetypes (default: [1, 4, 2, 3, 5])
ts_lwd_list: list of linewidths (default: [2, 2, 2, 2, 2])
Gleckler plot:
gl_png_res: height for png figures (default: 480). The width of the figure is computed automatically.
gl_png_units: units for figure size (default: “px”)
gl_png_pointsize: fontsize (default: 12)
gl_png_bg: background color (default: “white”)
gl_mar_par: page margins vector (default: [10, 4, 3, 14])
gl_rmsespacer: spacing of RMSE column (default: 0.01)
gl_scaling_factor: scaling factor for colorscale height (default: 0.9)
gl_text_scaling_factor: scaling factor for text size (default: 1.0)
gl_xscale_spacer_rmse: horizontal posizion of coloured colorbar (default: 0.05)
gl_xscale_spacer_rmsestd: horizontal posizion of gray colorbar (default: 0.05)
gl_symb_scaling_factor: scaling factor for white “symbol” square explaining the partition (default: 1.0)
gl_symb_xshift: horizontal position of the symbol box (default: 0.2)
gl_symb_yshift: vertical position of the symbol box (default: 0.275)
gl_text_symb_scaling_factor: scaling factor for text to be used for symbol box (default: 0.5)
Variables
tas (atmos, daily mean, longitude latitude time)
tasmin (atmos, daily minimum, longitude latitude time)
tasmax (atmos, daily maximum, longitude latitude time)
pr (atmos, daily mean, longitude latitude time)
Observations and reformat scripts
None.
References
Zhang, X., Alexander, L., Hegerl, G. C., Jones, P., Klein Tank, A., Peterson, T. C., Trewin, B., Zwiers, F. W., Indices for monitoring changes in extremes based on daily temperature and precipitation data, WIREs Clim. Change, doi:10.1002/wcc.147, 2011
Sillmann, J., V. V. Kharin, X. Zhang, and F. W. Zwiers, Climate extreme indices in the CMIP5 multi-model ensemble. Part 1: Model evaluation in the present climate. J. Geophys. Res., doi:10.1029/2012JD018390, 2013
Example plots
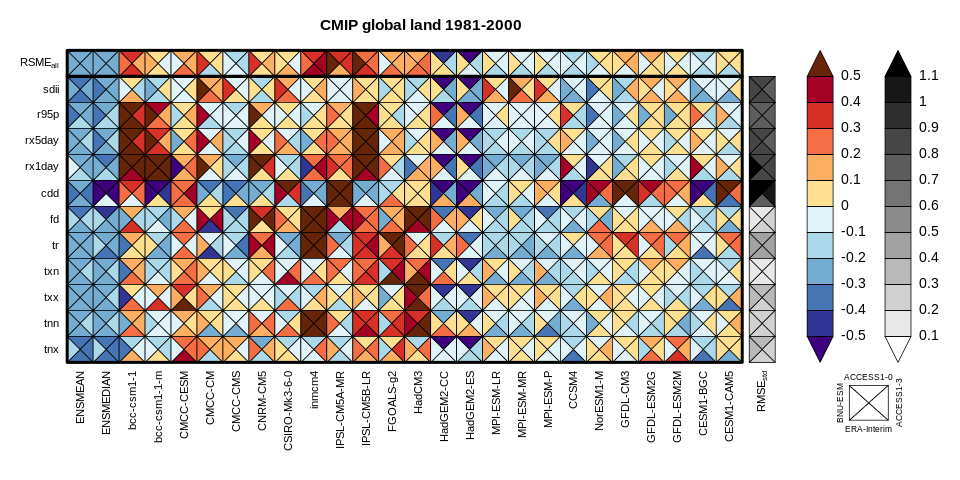
Fig. 19 Portrait plot of relative error metrics for the CMIP5 temperature and precipitation extreme indices evaluated over 1981-2000. Reproduces Fig. 9.37 of the IPCC AR5 report, Chapter 9.
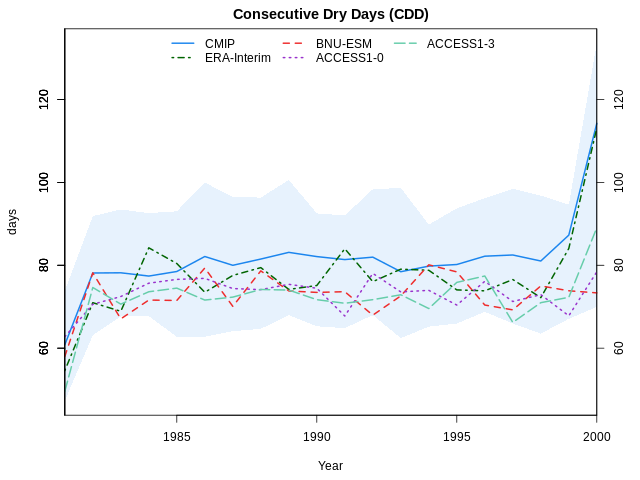
Fig. 20 Timeseries of the Consecutive Dry Days index over 1981-2000 for a selection of CMIP5 models, the CMIP5 multi-model mean (CMIP) and ERA-Interim. Shading is used to reproduce the multi-model spread.