Emergent constraints on carbon cycle feedbacks
Overview
Figures from Wenzel et al. (2014) are reproduced with recipe_wenzel14jgr.yml. Variables relevant for the carbon cycle - climate feedback such as near surface air temperature (tas), net biosphere productivity (nbp) and carbon flux into the ocean (fgco2) are analyzed for coupled (1pctCO2, here the carbon cycle is fully coupled to the climate response) and uncoupled (esmFixCLim1, here the carbon cycle is uncoupled to the climate response) simulations. The standard namelist includes a comparison of cumulated nbp from coupled and uncoupled simulations and includes a set of routines to diagnose the long-term carbon cycle - climate feedback parameter (GammaLT) from an ensemble of CMIP5 models. Also included in the recipe is a comparison of the interannual variability of nbp and fgco2 for historical simulations used to diagnose the observable sensitivity of CO2 to tropical temperature changes (GammaIAV). As a key figure of this recipe, the diagnosed values from the models GammaLT vs. GammaIAV are compared in a scatter plot constituting an emergent constraint.
Available recipes and diagnostics
Recipes are stored in recipes/
recipe_wenzel14jgr.yml
Diagnostics are stored in diag_scripts/
carbon_tsline.ncl: time line plots of annual means for spatial averages
carbon_gammaHist.ncl: scatter plot of annual mean anomalies of two different variables; diagnosing and saving GammaIAV
carbon_constraint.ncl: scatter plot of GammaLT vs. GammaIAV + line plot of probability density functions, diagnosing GammaLT
User settings
Note
Make sure to run this recipe setting max_parallel_tasks: 1 in the config_user.yml
file or using the CLI flag --max_parallel_tasks=1.
User setting files (cfg files) are stored in nml/cfg_carbon/
carbon_tsline
Required Settings (scripts)
ts_minlat: minimum latitude for area averaging
ts_maxlat: maximum latitude for area averaging
ts_minlon: minimum longitude for area averaging
ts_maxlon: maximum longitude for area averaging
ts_maxyear: last year (time range)
ts_minyear: first year (time range)
plot_units: units to appear on Figure
time_avg: currently, only yearly is available
area_opper: type of area operation (sum)
styleset: Plot style
Optional settings (scripts)
multi_model_mean: True for multi-model mean calculation
volcanoes: True for marking years with lage volcanic eruptions
align: True for aligning models to have the same start year (needed for idealized 2x CO2 simulations)
ts_anomaly: calculates anomalies with respect to a defined time range average (anom)
ridx_start: if ts_anomaly is True, define start time index for reference period
ridx_end: if ts_anomaly is True, define end time index for reference period
ref_start: if ts_anomaly is True, define start year for reference period
ref_end: if ts_anomaly is True, define end year for reference period
Required settings (variables)
reference_dataset: name of reference data set
carbon_gammaHist.ncl
Required Settings (scripts)
start_year: first year (time range)
end_year: last year (time range)
plot_units: units to appear on Figure
ec_anom: calculates anomalies with respect to the first 10-year average (anom)
scatter_log: set logarithmic axes in scatterplot.ncl
styleset: Plot style
Optional settings (scripts)
ec_volc : exclude 2 years after volcanic erruptions (True/False)
carbon_constraint.ncl
Required Settings (scripts)
gIAV_diagscript: “gammaHist_Fig3and4”
gIAV_start: start year of GammIAV calculation period
gIAV_end: end year of GammIAV calculation period
ec_anom: True
con_units: label string for units, e.g. (GtC/K)
nc_infile: specify path to historical gamma values derived by carbon_gammaHist.ncl
styleset: Plot style
Optional settings (scripts)
reg_models: Explicit naming of individual models to be excluded from the regression
Variables
tas (atmos, monthly mean, longitude latitude time)
nbp (land, monthly mean, longitude latitude time)
fgco2 (ocean, monthly mean, longitude latitude time)
Observations and reformat scripts
GCP2018: Global Carbon Budget including land (nbp) and ocean (fgco2) carbon fluxes
NCEP: National Centers for Environmental Prediction reanalysis data for near surface temperature
References
Cox, P. M., D. B. Pearson, B. B. Booth, P. Friedlingstein, C. C. Huntingford, C. D. B. Jones, and C. M. Luke, 2013, Sensitivity of tropical carbon to climate change constrained by carbon dioxide variability, Nature, 494(7437), 341-344. doi: 10.1038/nature11882
Wenzel, S., P. M. Cox, V. Eyring, and P. Friedlingstein, 2014, Emergent Constraints on Climate Carbon Cycle Feedbacks in the CMIP5 Earth System Models, JGR Biogeoscience, 119(5), doi: 2013JG002591.
Example plots
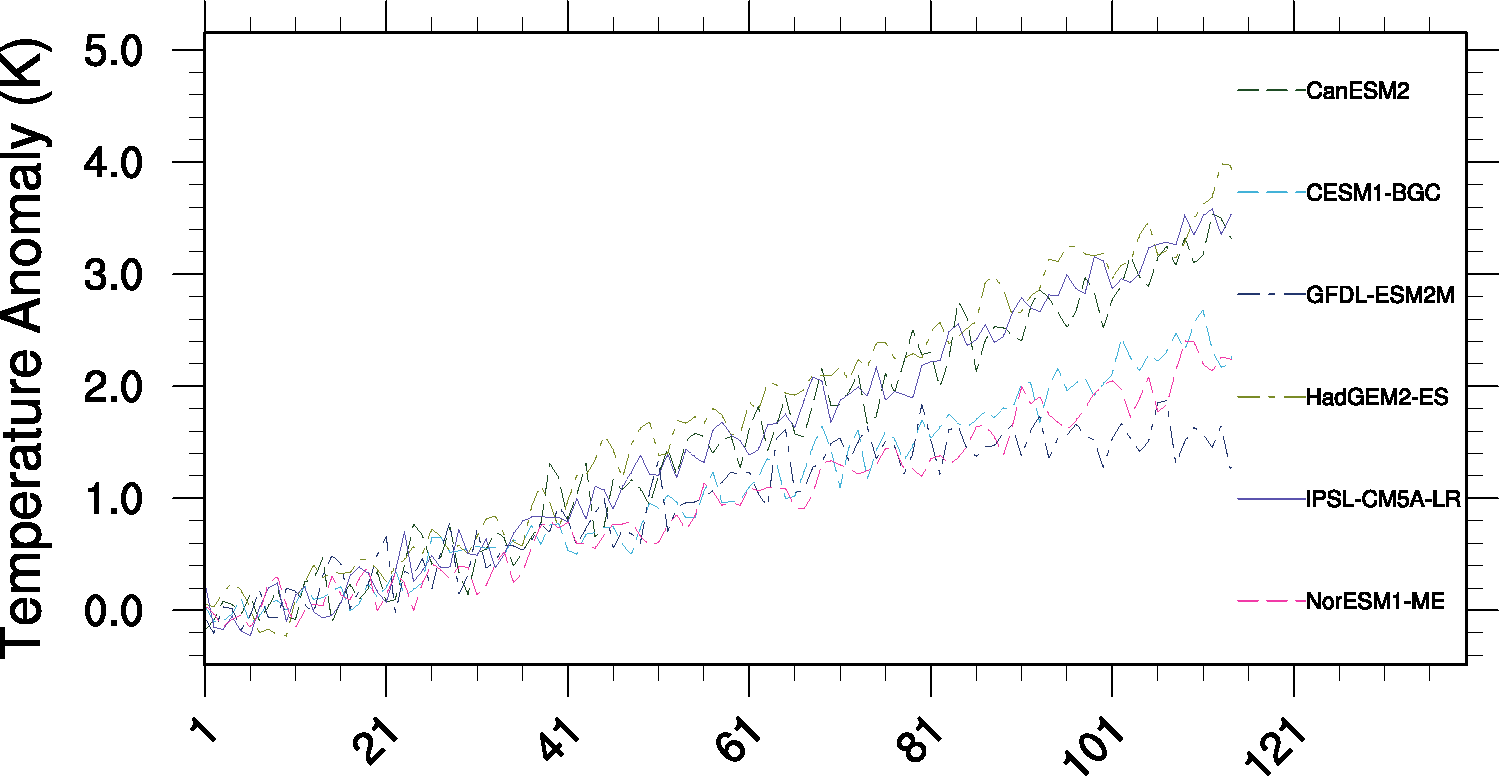
Fig. 95 Time series of tropical (30S to 30N) mean near surface temperature (tas) change between year 30 and year 110 for the CMIP5 models simulated with prescribed CO2 (1%/yr CO2 increase) coupled simulation (1pctCO2).
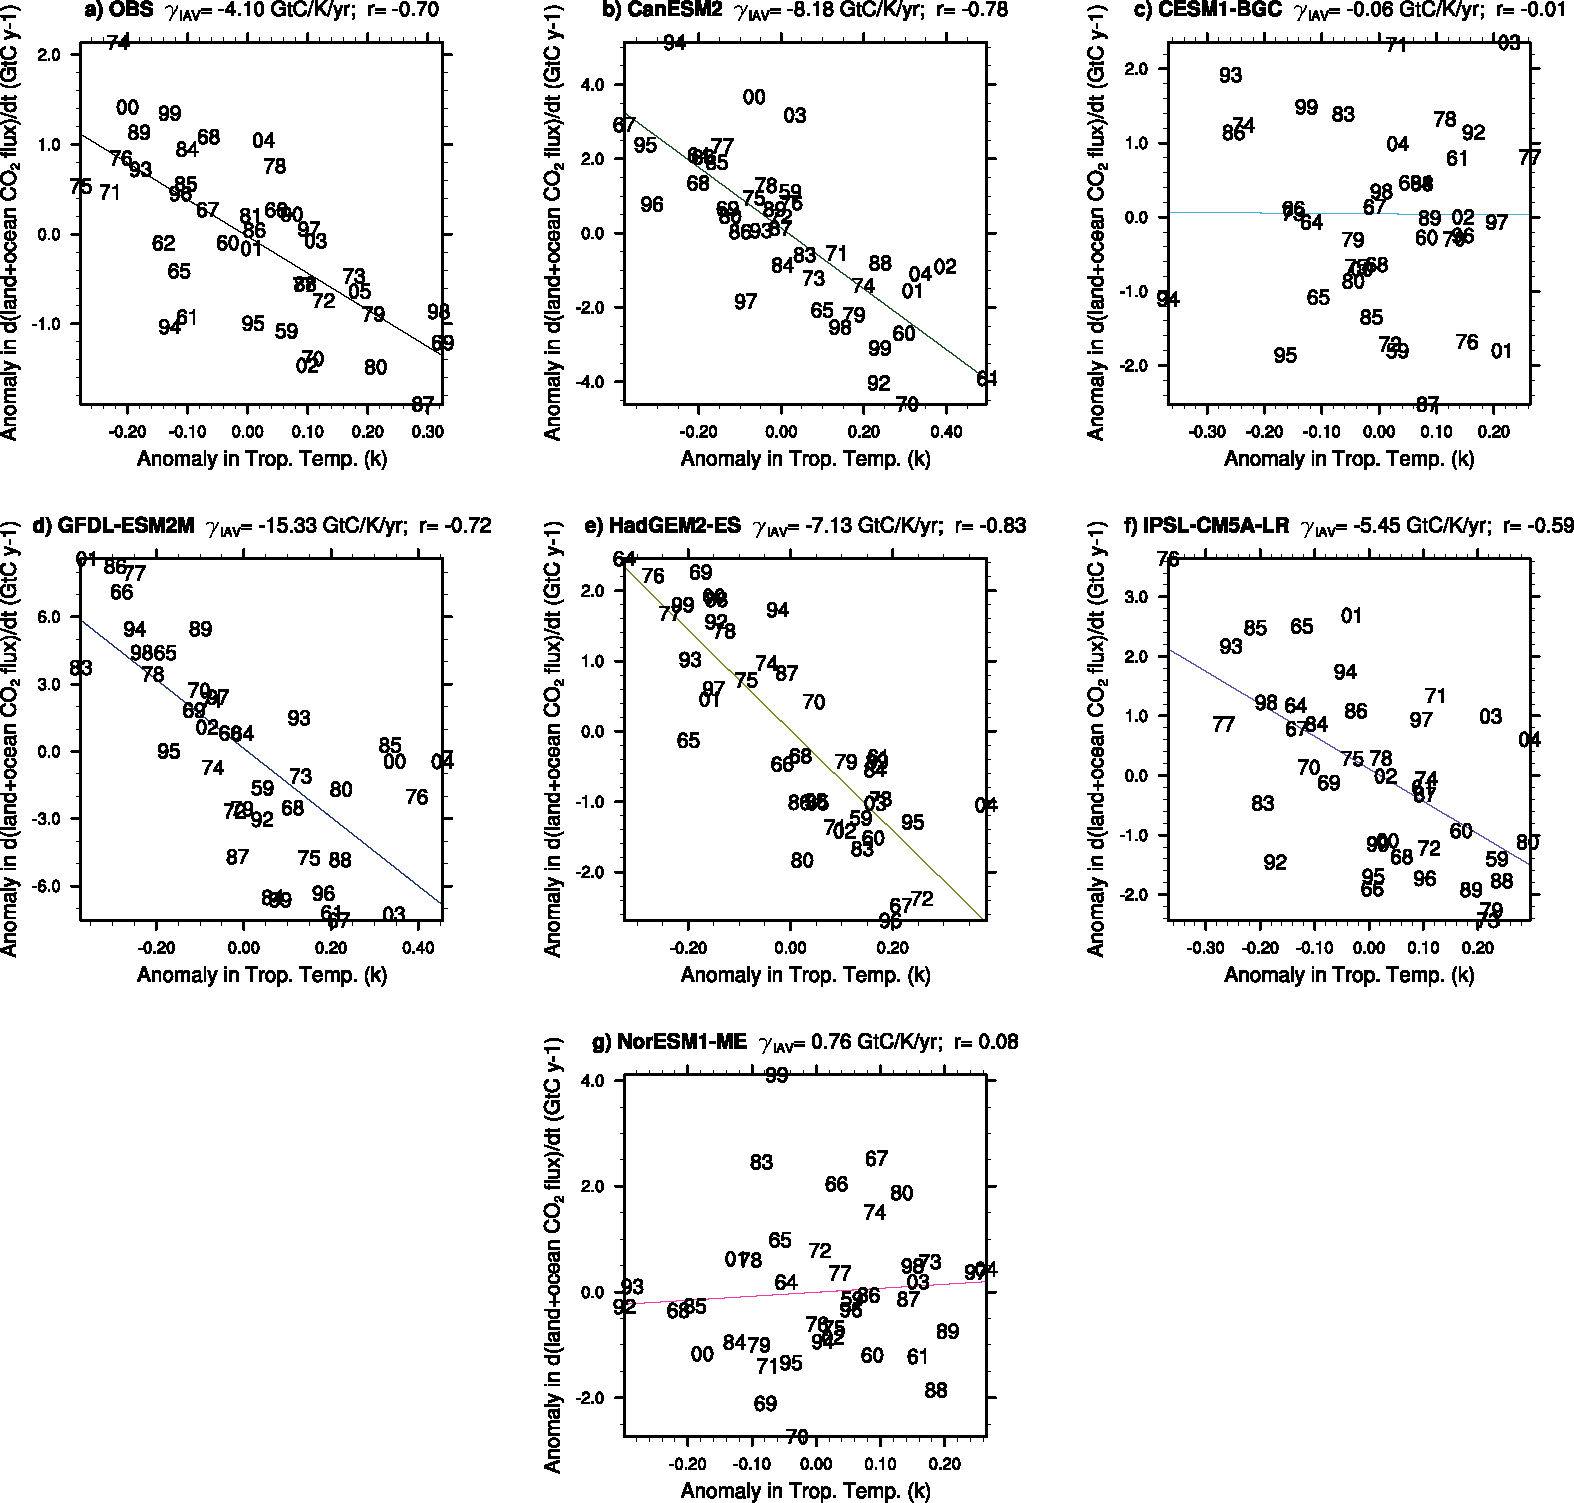
Fig. 96 Correlations between the interannual variability of global co2flux (nbp+fgco2) and tropical temperature for the individual CMIP5 models using esmHistorical simulations, and for observations.
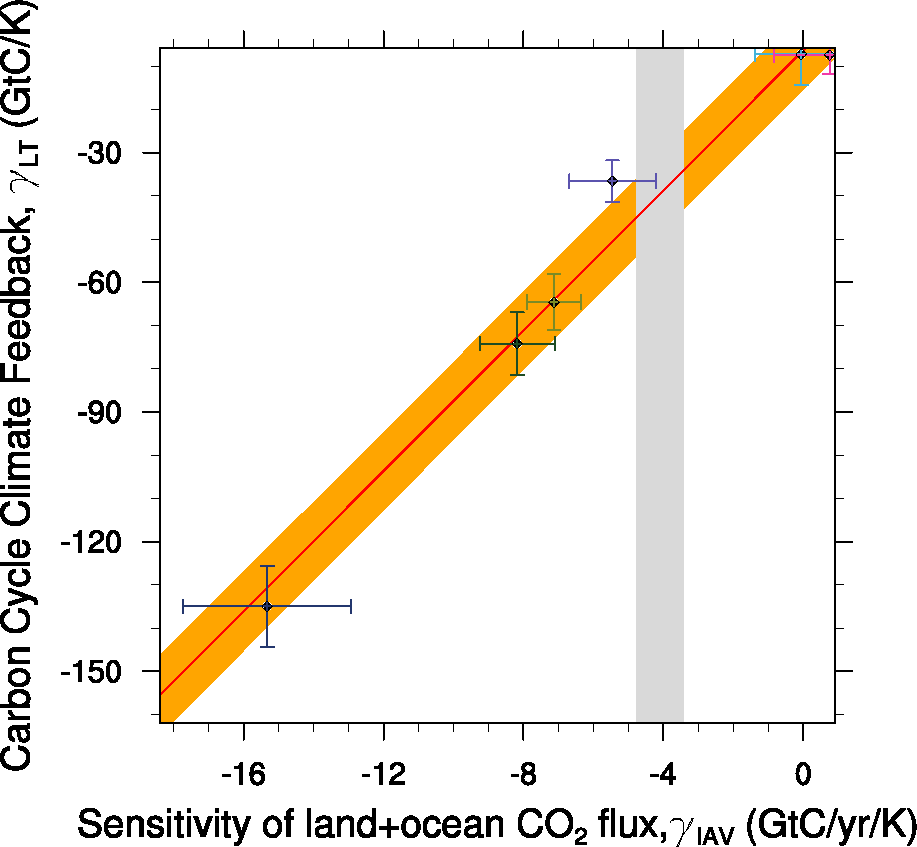
Fig. 97 Carbon cycle-climate feedback of tropical land carbon vs. the sensitivity of co2flux to interannual temperature variability in the tropics (30S to 30N). The red line shows the linear best fit of the regression together with the prediction error (orange shading) and the gray shading shows the observed range.
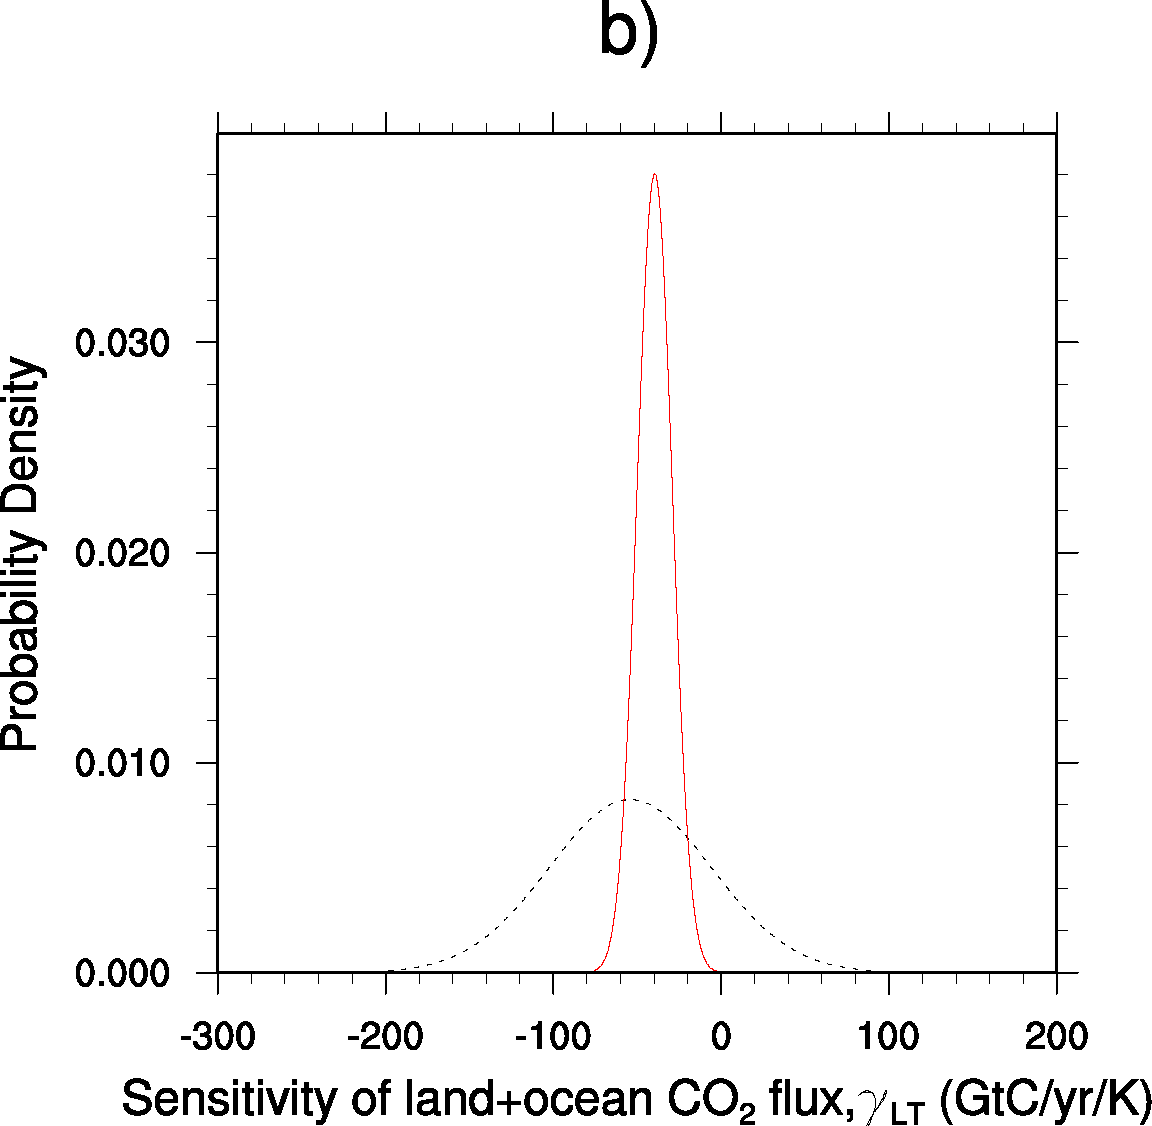
Fig. 98 Probability Density Functions for the pure CMIP5 ensemble (black dashed) and after applying the observed constraint to the models (red solid)