Emergent constraint on snow-albedo effect
Overview
The recipe recipe_snowalbedo.yml computes the springtime snow-albedo feedback values in climate change versus springtime values in the seasonal cycle in transient climate change experiments following Hall and Qu (2006). The strength of the snow-albedo effect is quantified by the variation in net incoming shortwave radiation (Q) with surface air temperature (Ts) due to changes in surface albedo \(\alpha_s\):
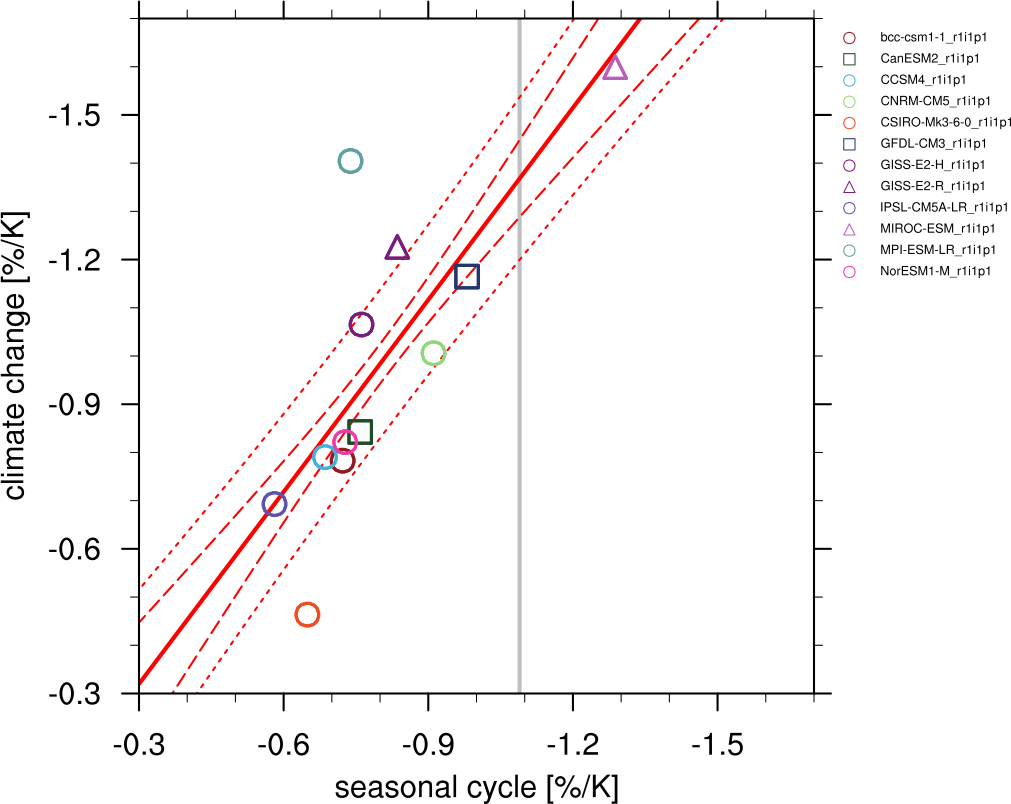
The diagnostic produces scatterplots of simulated springtime \(\Delta \alpha_s\)/\(\Delta T_s\) values in climate change (ordinate) vs. simulated springtime \(\Delta \alpha_s\)/\(\Delta T_s\) values in the seasonal cycle (abscissa).
Ordinate values: the change in April \(\alpha_s\) (future projection - historical) averaged over NH land masses poleward of 30°N is divided by the change in April Ts (future projection - historical) averaged over the same region. The change in \(\alpha_s\) (or Ts) is defined as the difference between 22nd-century-mean \(\alpha_s\): (Ts) and 20th-century-mean \(\alpha_s\). Values of \(\alpha_s\) are weighted by April incoming insolation (It) prior to averaging.
Abscissa values: the seasonal cycle \(\Delta \alpha_s\)/\(\Delta T_s\) values, based on 20th century climatological means, are calculated by dividing the difference between April and May \(\alpha_s\): averaged over NH continents poleward of 30°N by the difference between April and May Ts averaged over the same area. Values of \(\alpha_s\): are weighted by April incoming insolation prior to averaging.
Available recipes and diagnostics
Recipes are stored in recipes/
recipe_snowalbedo.yml
Diagnostics are stored in diag_scripts/emergent_constraints/
snowalbedo.ncl: springtime snow-albedo feedback values vs. seasonal cycle
User settings in recipe
Script snowalbedo.ncl
Required settings for script
exp_presentday: name of present-day experiment (e.g. “historical”)
exp_future: name of climate change experiment (e.g. “rcp45”)
Optional settings for script
diagminmax: observational uncertainty (min and max)
legend_outside: create extra file with legend (true, false)
styleset: e.g. “CMIP5” (if not set, this diagnostic will create its own color table and symbols for plotting)
suffix: string to be added to output filenames
xmax: upper limit of x-axis (default = automatic)
xmin: lower limit of x-axis (default = automatic)
ymax: upper limit of y-axis (default = automatic)
ymin: lower limit of y-axis (default = automatic)
Required settings for variables
ref_model: name of reference data set
Optional settings for variables
none
Required settings (scripts)
none
Optional settings (scripts)
Variables
tas (atmos, monthly mean, longitude latitude time)
rsdt (atmos, monthly mean, longitude latitude time)
rsuscs, rsdscs (atmos, monthly mean, longitude latitude time)
Observations and reformat scripts
ERA-Interim (tas - esmvaltool/cmorizers/data/formatters/datasets/era_interim.py)
ISCCP-FH (rsuscs, rsdscs, rsdt - esmvaltool/cmorizers/data/formatters/datasets/isccp_fh.ncl)
References
Flato, G., J. Marotzke, B. Abiodun, P. Braconnot, S.C. Chou, W. Collins, P. Cox, F. Driouech, S. Emori, V. Eyring, C. Forest, P. Gleckler, E. Guilyardi, C. Jakob, V. Kattsov, C. Reason and M. Rummukainen, 2013: Evaluation of Climate Models. In: Climate Change 2013: The Physical Science Basis. Contribution of Working Group I to the Fifth Assessment Report of the Intergovernmental Panel on Climate Change [Stocker, T.F., D. Qin, G.-K. Plattner, M. Tignor, S.K. Allen, J. Boschung, A. Nauels, Y. Xia, V. Bex and P.M. Midgley (eds.)]. Cambridge University Press, Cambridge, United Kingdom and New York, NY, USA.
Hall, A., and X. Qu, 2006: Using the current seasonal cycle to constrain snow albedo feedback in future climate change, Geophys. Res. Lett., 33, L03502, doi:10.1029/2005GL025127.
Example plots

Fig. 105 Scatterplot of springtime snow-albedo effect values in climate change vs. springtime \(\Delta \alpha_s\)/\(\Delta T_s\) values in the seasonal cycle in transient climate change experiments (CMIP5 historical experiments: 1901-2000, RCP4.5 experiments: 2101-2200). Similar to IPCC AR5 Chapter 9 (Flato et al., 2013), Figure 9.45a.