Constraining uncertainty in projected gross primary production (GPP) with machine learning
Overview
These recipes reproduce the analysis of Schlund et al., JGR: Biogeosciences (2020). In this paper, a machine learning regression (MLR) approach (using the MLR algorithm Gradient Boosted Regression Trees, GBRT) is proposed to constrain uncertainties in projected gross primary production (GPP) in the RCP 8.5 scenario using observations of process-based diagnostics.
Available recipes and diagnostics
Recipes are stored in recipes/
schlund20jgr/recipe_schlund20jgr_gpp_abs_rcp85.yml
schlund20jgr/recipe_schlund20jgr_gpp_change_1pct.yml
schlund20jgr/recipe_schlund20jgr_gpp_change_rcp85.yml
Diagnostics are stored in diag_scripts/
General information (including an example and more details) on machine learning regression (MLR) diagnostics is given here. The API documentation is available here.
Variables
co2s (atmos, monthly, longitude, latitude, time)
gpp (land, monthly, longitude, latitude, time)
gppStderr (land, monthly, longitude, latitude, time)
lai (land, monthly, longitude, latitude, time)
pr (atmos, monthly, longitude, latitude, time)
rsds (atmos, monthly, longitude, latitude, time)
tas (atmos, monthly, longitude, latitude, time)
Observations and reformat scripts
CRU (pr, tas)
ERA-Interim (rsds)
LAI3g (lai)
MTE (gpp, gppStderr)
Scripps-CO2-KUM (co2s)
References
Schlund, M., Eyring, V., Camps‐Valls, G., Friedlingstein, P., Gentine, P., & Reichstein, M. (2020). Constraining uncertainty in projected gross primary production with machine learning. Journal of Geophysical Research: Biogeosciences, 125, e2019JG005619, https://doi.org/10.1029/2019JG005619.
Example plots
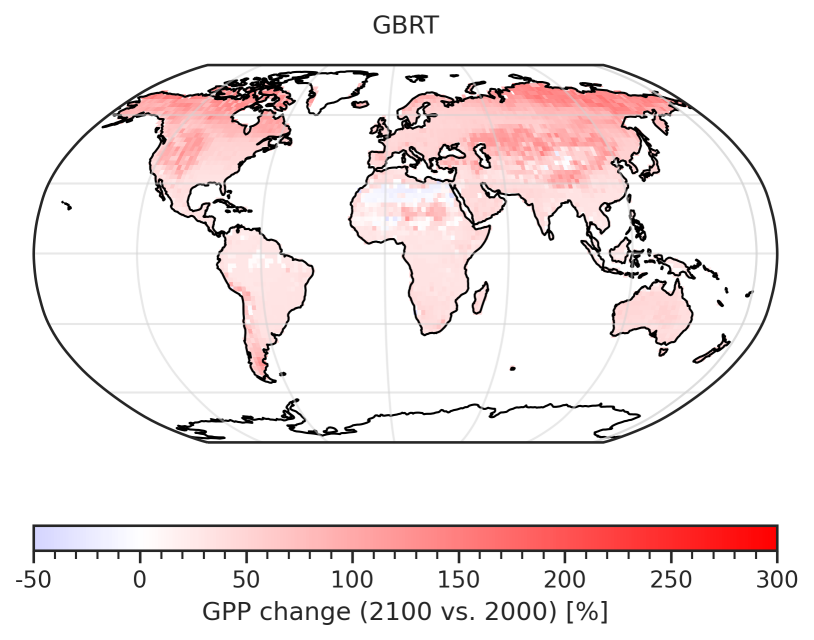
Fig. 79 GBRT-based prediction of the fractional GPP change over the 21st century (= GPP(2091-2100) / GPP(1991-2000)).
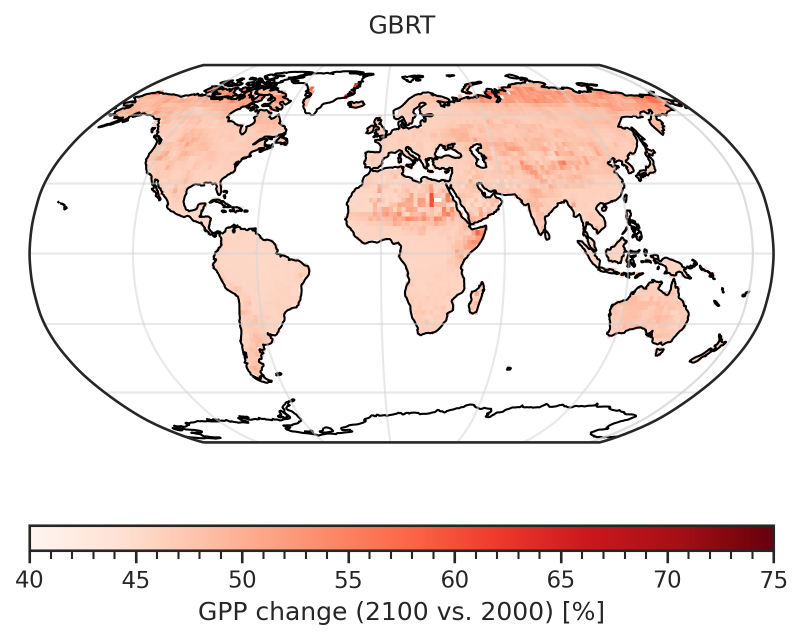
Fig. 80 Corresponding error of the GBRT-based prediction of the fractional GPP change over the 21st century (considering errors in the MLR model and errors in the predictors).
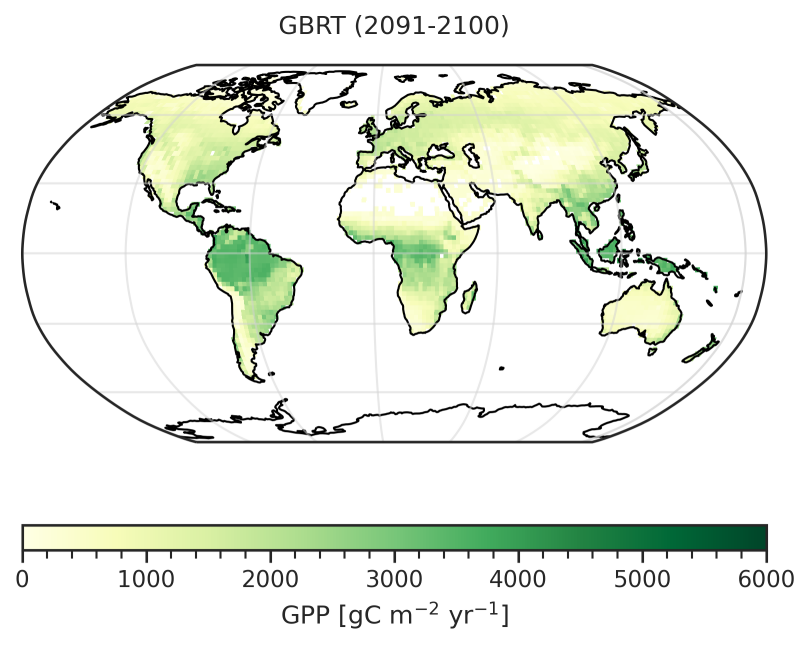
Fig. 81 GBRT-based prediction of the absolute GPP at the end of the 21st century (2091-2100).
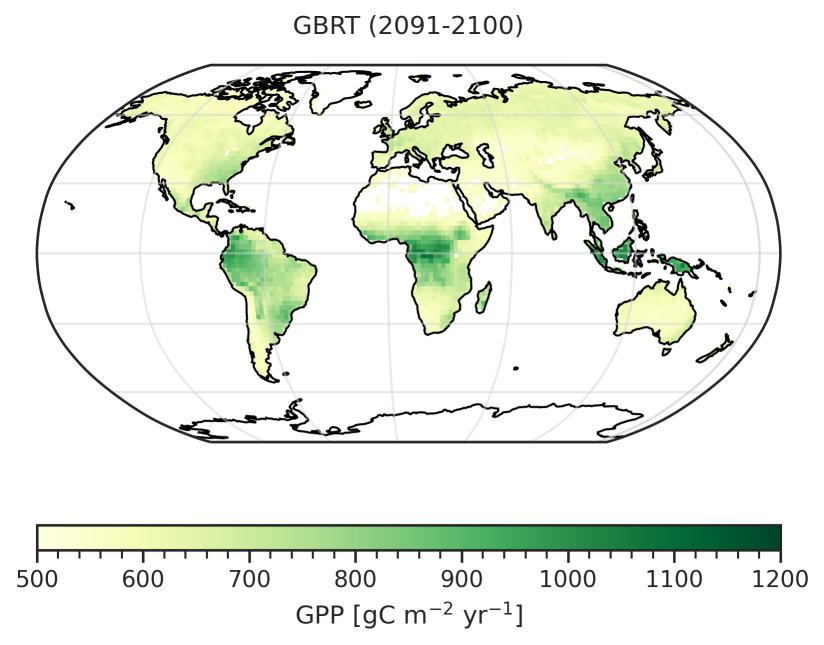
Fig. 82 Corresponding error of the GBRT-based prediction of the absolute GPP at the end of the 21st century (considering errors in the MLR model and errors in the predictors).
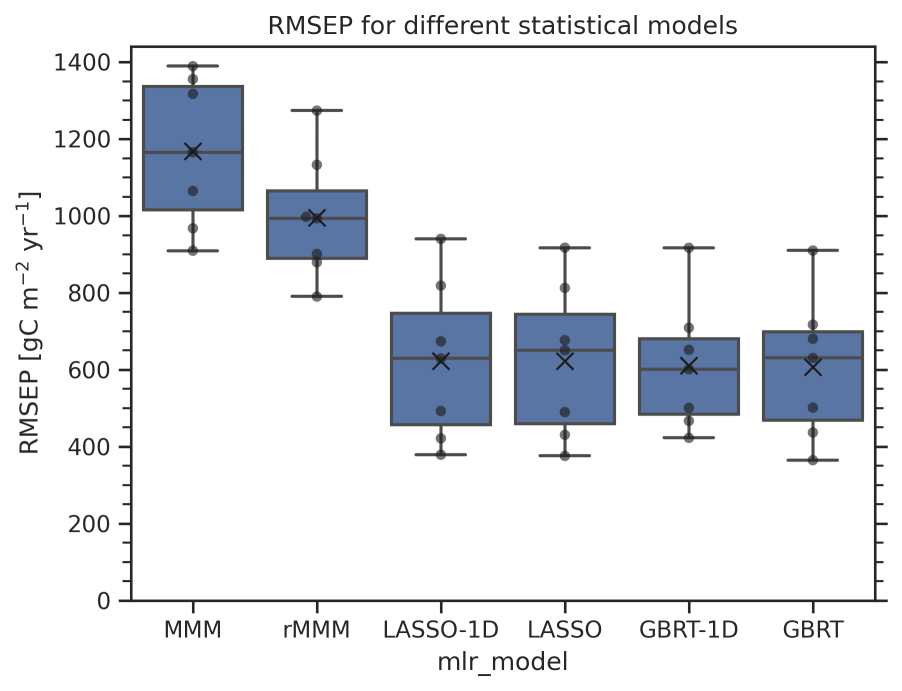
Fig. 83 Boxplot of the root mean square error of prediction (RMSEP) distributions for six different statistical models used to predict future absolute GPP (2091-2100) using a leave-one-model-out cross-validation approach. The distribution for each statistical model contains seven points (black dots, one for each climate model used as truth) and is represented in the following way: the lower and upper limit of the blue boxes correspond to the 25% and 75% quantiles, respectively. The central line in the box shows the median, the black “x” the mean of the distribution. The whiskers outside the box represent the range of the distribution
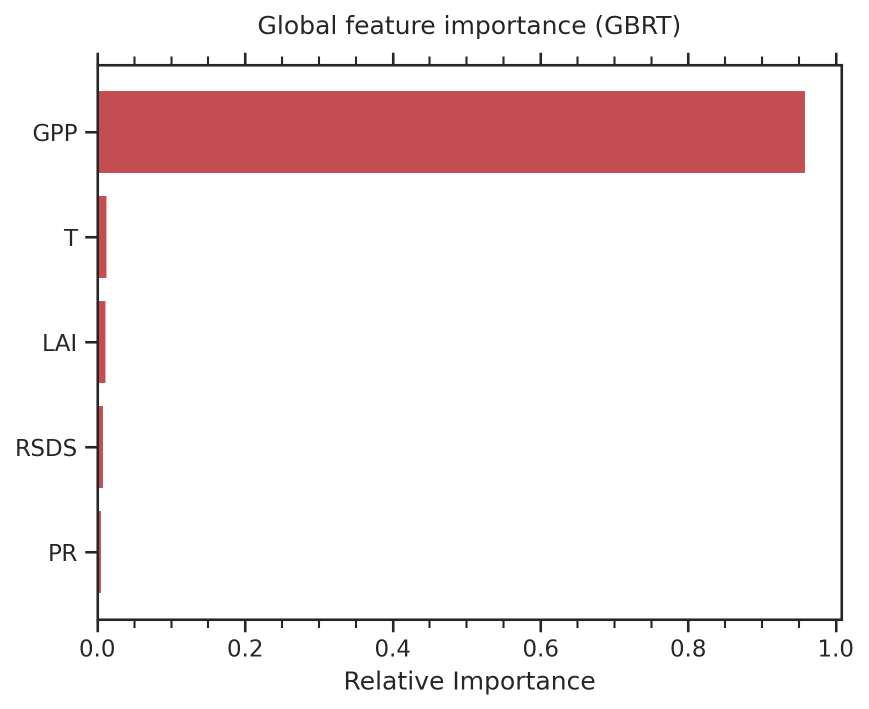
Fig. 84 Global feature importance of the GBRT model for prediction of the absolute GPP at the end of the 21st century (2091-2100).
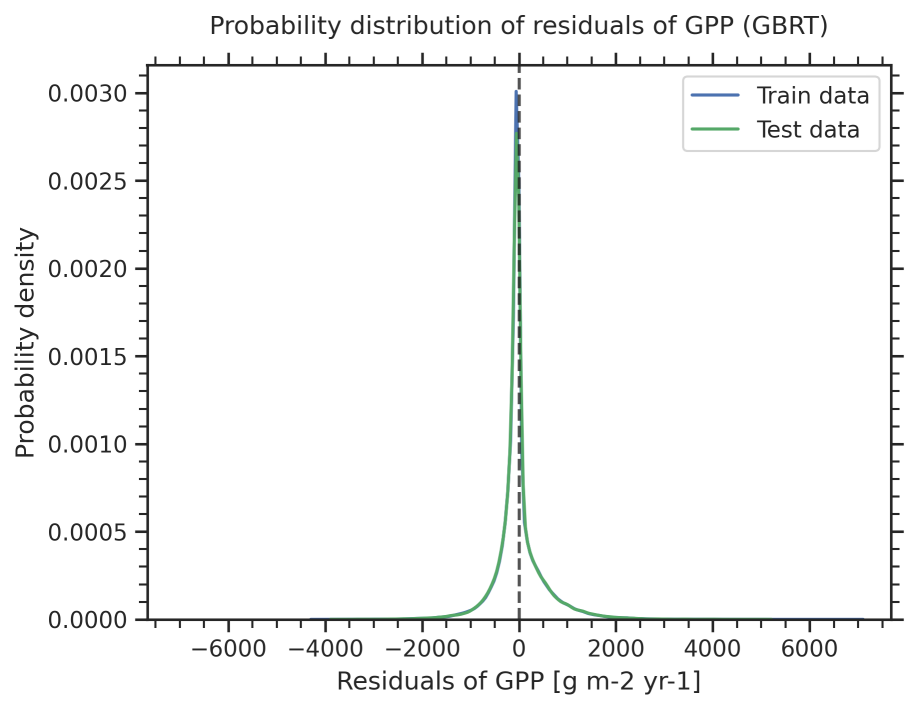
Fig. 85 Distribution of the residuals of the GBRT model for the prediction of absolute GPP at the end of the 21st century (2091-2100) for the training data (blue) and test data excluded from training (green).
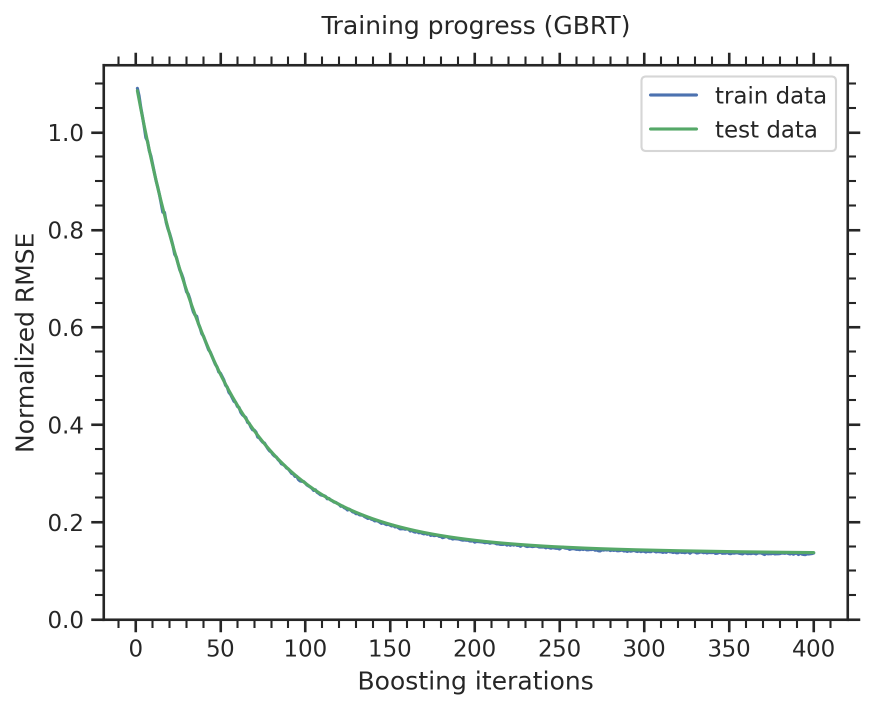
Fig. 86 Training progress of the GBRT model for the prediction of absolute GPP at the end of the 21st century (2091-2100) evaluated as normalized root mean square error on the training data (blue) and test data excluded from training (green).