Capacity factor for solar photovoltaic (PV) systems
Overview
This diagnostic computes the photovoltaic (PV) capacity factor, a measure of the fraction of the maximum possible energy produced per PV grid cell. It uses the daily incoming surface solar radiation and the surface temperature with a method described in Bett and Thornton (2016). The user can select temporal range, season, and region of interest.
Available recipes and diagnostics
Recipes are stored in recipes/
recipe_pv_capacity_factor.yml
Diagnostics are stored in diag_scripts/pv_capacityfactor/
pv_capacity_factor.R: prepares data and plots results.
PV_CF.R: calculates the daily capacity factor.
User settings
User setting files are stored in recipes/
recipe_capacity_factor.yml
Required settings for script
season: String to include shortcut for season in plot title and name (e.g. “djf”). It will be converted to upper case. This season should be the one set in the preprocessor, since it is only used as a string and does not affect the data in the diagnostic. In the default recipe this is solved through a node anchor.
Optional settings for script
maxval_colorbar: Optional upper limit for the colorbar.
Variables
tas (atmos, daily, longitude, latitude, time)
rsds (atmos, daily, longitude, latitude, time)
Observations and reformat scripts
ERA-Interim
References
Bett, P. E. and Thornton, H. E.: The climatological relationships between wind and solar energy supply in Britain, Renew. Energ., 87, 96–110, https://doi.org/10.1016/j.renene.2015.10.006, 2016.
Example plots
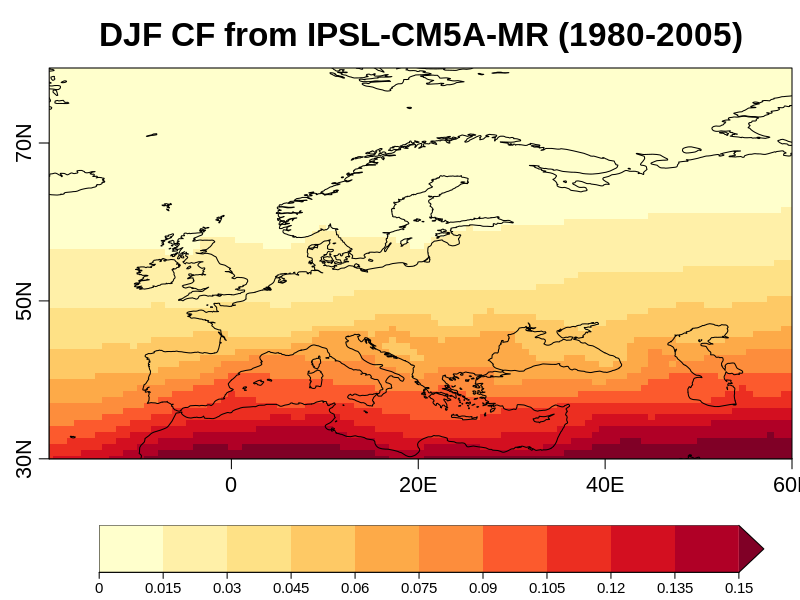
PV capacity factor calculated from IPSL-CM5-MR during the DJF season for 1980–2005.