ESA CCI LST comparison to Historical Models
Overview
This diagnostic compares ESA CCI LST to multiple historical emsemble members of CMIP models. It does this over a defined region for monthly values of the land surface temperature. The result is a plot showing the mean differnce of CCI LST to model average LST, with a region of +/- one standard deviation of the model mean LST given as a measure of model variability.
The recipe and diagnostic need the all time average monthly LST from the CCI data. We use the L3C single sensor monthy data. A CMORizing script calculates the mean of the day time, and night time overpasses to give the all time average LST. This is so that the Amon output from CMIP models can be used. We created such a dataset from the Aqua MODIS data from CCI.
Available recipes and diagnostics
Recipes are stored in esmvaltool/recipes/
recipe_esacci_lst.yml
Diagnostics are stored in esmvaltool/diag_scripts/lst/
lst.py
User settings in recipe
Script
recipe_esacci_lst.ymlNo required settings for script
No user defined inputs to the diagnostic
Required settings for variables
The diagnostic works with all data sources on having the same start_year and end_year, and hence that data is also available.
Required settings for preprocessor
start_longitude, end_longitude The western and eastern bounds of the region to work with.
start_latitude, end_latitude The southern and northern bounds of the region to work with.
target_grid This should be one of the model grids.
Variables
ts (atmos, monthly mean, longitude latitude time)
Observations and reformat scripts
This recipe and diagnostic is written to work with data created from the CMORizer esmvaltool/cmorizers/obs/cmorize_obs_esacci_lst.py. This takes the orginal ESA CCI LST files for the L3C data from Aqua MODIS DAY and NIGHT files and creates a the all time mean data this diagnostic uses. Advice from the CCI LST team is to use the monthly not daily files to create the all time average to avoid th epossibility of biasing towards night time LST values being more prevalent because of how the cloud screening algorithms work.
References
ESA CCI LST project https://climate.esa.int/en/projects/land-surface-temperature/
Example plots
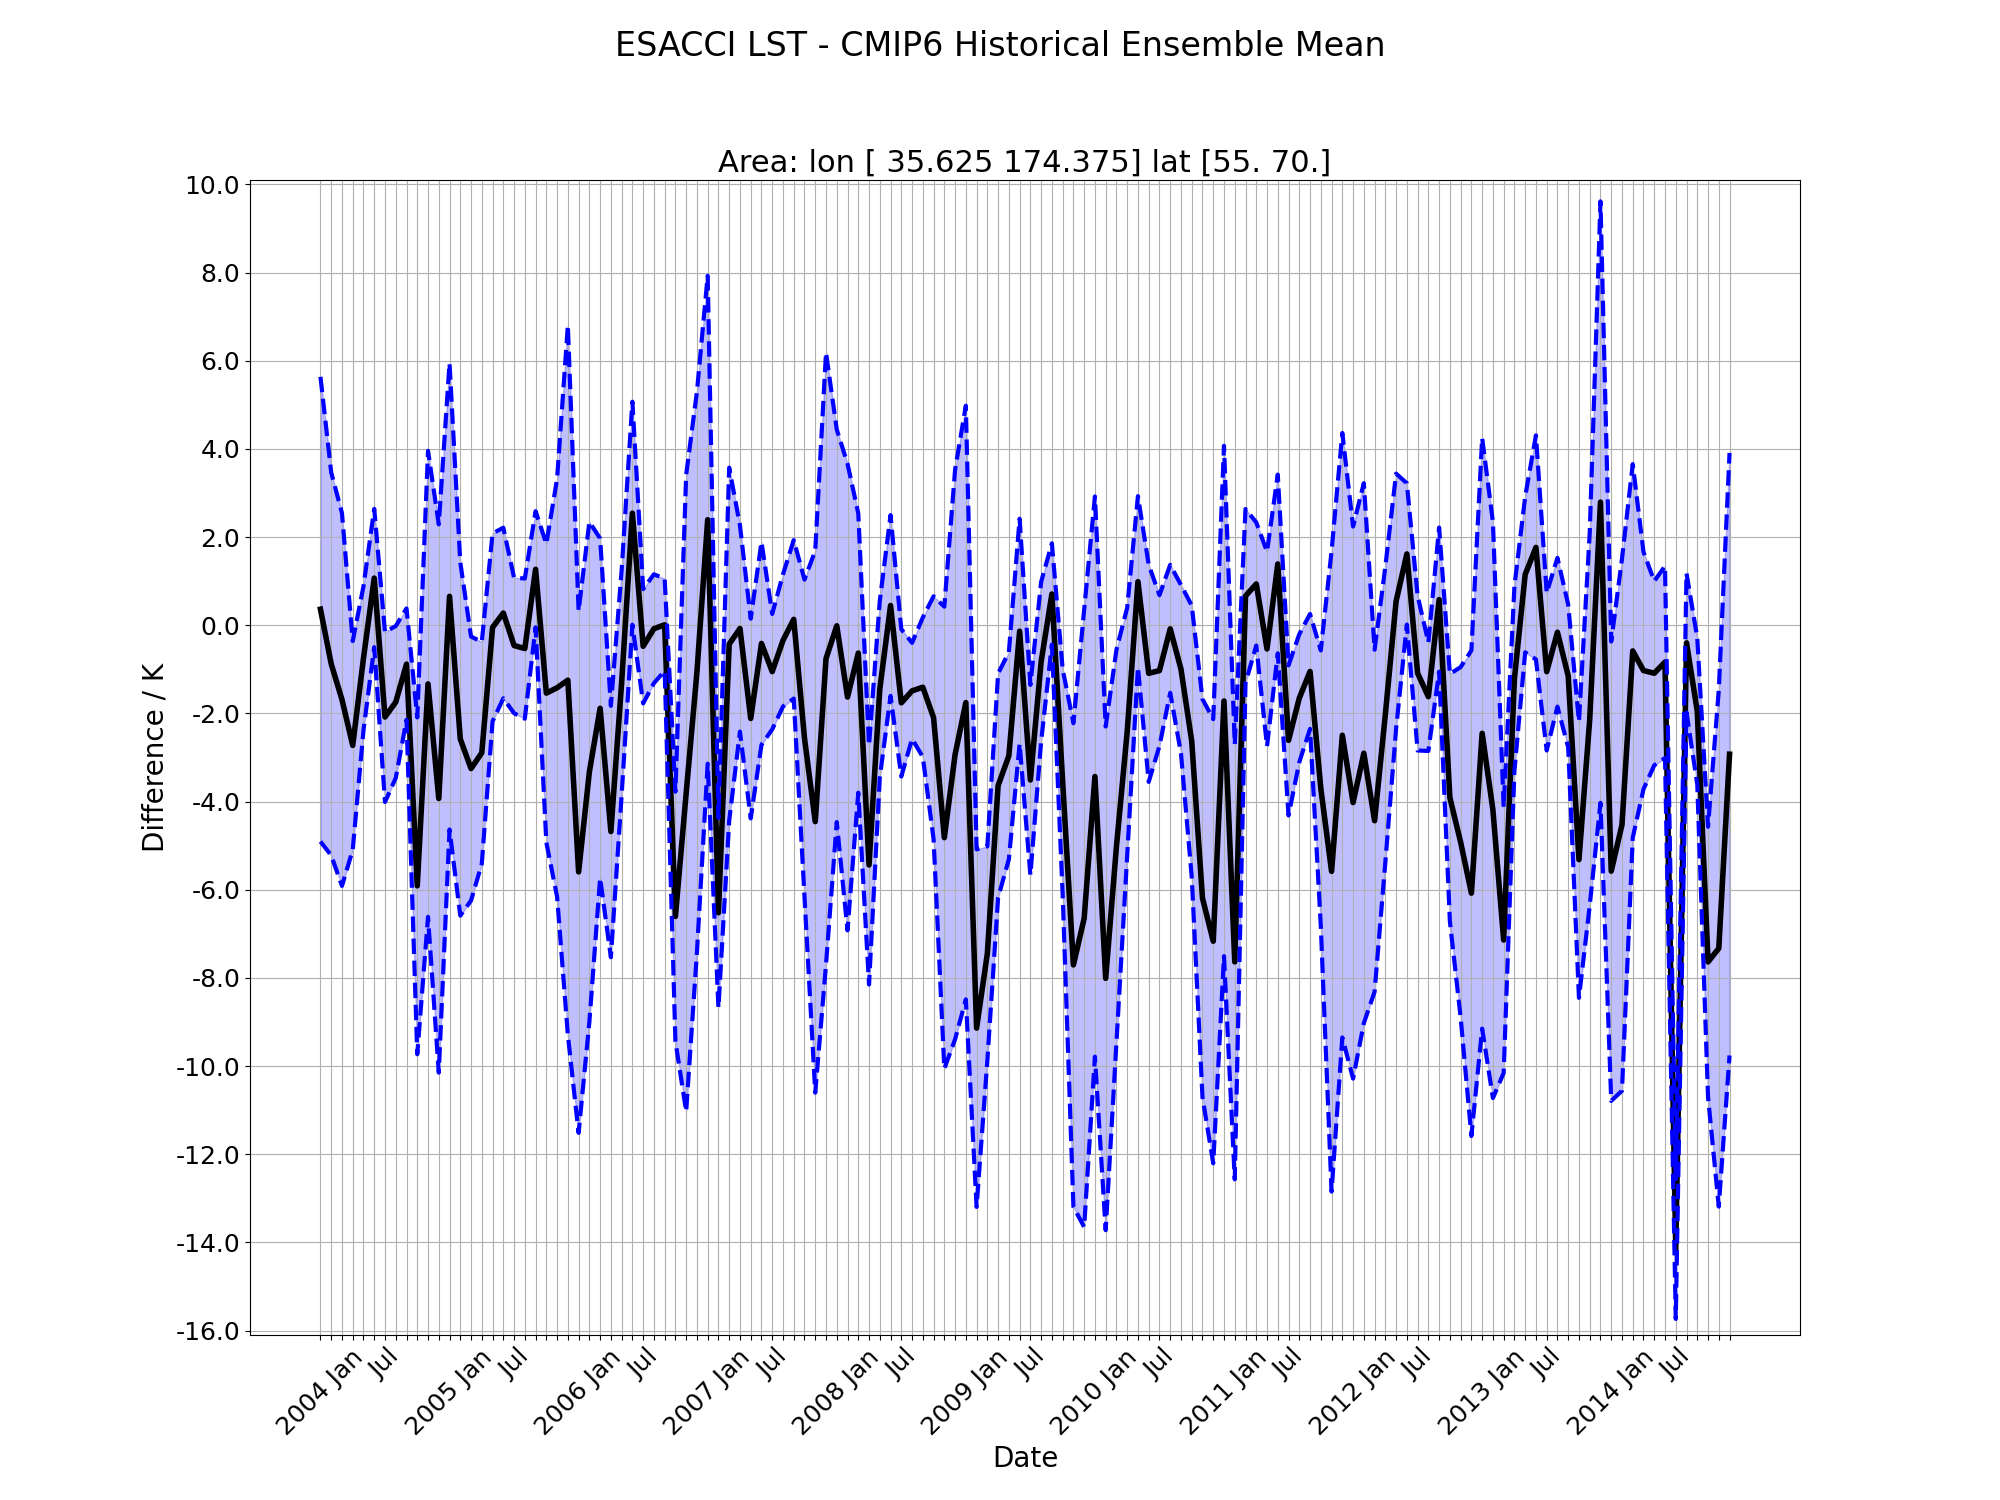
Fig. 198 Timeseries of the ESA CCI LST minus mean of CMIP6 ensembles. The selected region is 35E-175E, 55N-70N. The black line is the mean difference, and the blue shaded area denotes one standard deviation either way of the individual ensemble member’s differecen in LST. Models used for this are UKESM1 members r1i1p1f2 and r2i1p1f2, and CESM members r2i1p1f1 and r3i1p1f1. We have used the entire timeseries of available CCI data 2004-2014 inclusive, noting we have not written the CMORizer to process the incomplete year of 2003 for the Aqua MODIS data.