Transient Climate Response
Overview
The transient climate response (TCR) is defined as the global and annual mean surface air temperature anomaly in the 1pctCO2 scenario (1% CO2 increase per year) for a 20 year period centered at the time of CO2 doubling, i.e. using the years 61 to 80 after the start of the simulation. We calculate the temperature anomaly by subtracting a linear fit of the piControl run for all 140 years of the 1pctCO2 experiment prior to the TCR calculation (see Gregory and Forster, 2008).
Available recipes and diagnostics
Recipes are stored in recipes/
recipe_tcr.yml
Diagnostics are stored in diag_scripts/
climate_metrics/tcr.py
climate_metrics/create_barplot.py
climate_metrics/create_scatterplot.py
User settings in recipe
Preprocessor
area_statistics(operation: mean): Calculate global mean.
Script climate_metrics/tcr.py
calculate_mmm, bool, optional (default:True): Calculate multi-model mean TCR.plot, bool, optional (default:True): Plot temperature vs. time.read_external_file, str, optional: Read TCR from external file. The path can be given relative to this diagnostic script or as absolute path.savefig_kwargs, dict, optional: Keyword arguments formatplotlib.pyplot.savefig().seaborn_settings, dict, optional: Options forseaborn.set()(affects all plots).
Script climate_metrics/create_barplot.py
See here.
Script climate_metrics/create_scatterplot.py
See here.
Variables
tas (atmos, monthly, longitude, latitude, time)
Observations and reformat scripts
None
References
Gregory, J. M., and P. M. Forster. “Transient climate response estimated from radiative forcing and observed temperature change.” Journal of Geophysical Research: Atmospheres 113.D23 (2008).
Example plots
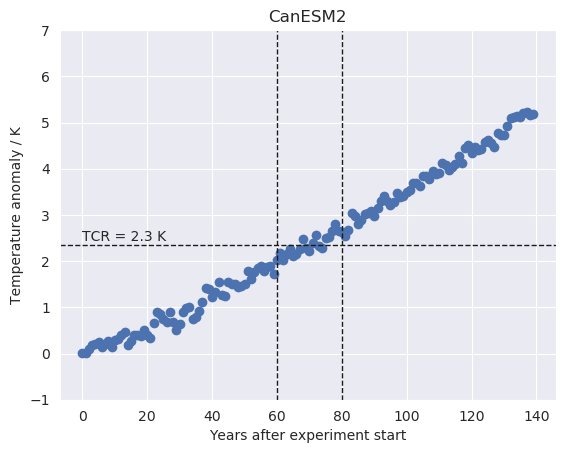
Fig. 115 Time series of the global mean surface air temperature anomaly (relative to the linear fit of the pre-industrial control run) of CanESM2 (CMIP5) for the 1% CO2 increase per year experiment. The horizontal dashed line indicates the transient climate response (TCR) defined as the 20 year average temperature anomaly centered at the time of CO2 doubling (vertical dashed lines).