Emergent constraints on equilibrium climate sensitivity in CMIP5: do they hold for CMIP6?
Overview
This recipe reproduces the analysis of Schlund et al., Earth Sys. Dyn. (2020). In this paper, emergent constraints on the equilibrium climate sensitivity are evaluated on CMIP5 and CMIP6 models. Since none of the considered emergent constraints have been developed on the CMIP6 ensemble, this allows an out-of-sample testing of the emergent constraints. Most emergent constraints show a reduced skill in CMIP6 when compared to CMIP5.
Available recipes and diagnostics
Recipes are stored in recipes/
recipe_schlund20esd.yml
Diagnostics are stored in diag_scripts/
More details on the emergent constraint module are given in the API documentation which is available here.
Variables
cl (atmos, monthly, longitude, latitude, level, time)
clt (atmos, monthly, longitude, latitude, time)
hur (atmos, monthly, longitude, latitude, level, time)
hus (atmos, monthly, longitude, latitude, level, time)
pr (atmos, monthly, longitude, latitude, time)
rsdt (atmos, monthly, longitude, latitude, time)
rsut (atmos, monthly, longitude, latitude, time)
rsutcs (atmos, monthly, longitude, latitude, time)
rtnt or rtmt (atmos, monthly, longitude, latitude, time)
ta (atmos, monthly, longitude, latitude, level, time)
tas (atmos, monthly, longitude, latitude, time)
tasa (atmos, monthly, longitude, latitude, time)
tos (atmos, monthly, longitude, latitude, time)
ts (atmos, monthly, longitude, latitude, time)
va (atmos, monthly, longitude, latitude, level, time)
wap (atmos, monthly, longitude, latitude, level, time)
Observations and reformat scripts
AIRS (hur, hus)
CERES-EBAF (rsut, rsutcs, rsdt)
ERA-Interim (hur, ta, va, wap)
GPCP-SG (pr)
HadCRUT4 (tasa)
HadISST (ts)
MLS-AURA (hur)
References
Schlund, M., Lauer, A., Gentine, P., Sherwood, S. C., and Eyring, V.: Emergent constraints on equilibrium climate sensitivity in CMIP5: do they hold for CMIP6?, Earth Syst. Dynam., 11, 1233–1258, https://doi.org/10.5194/esd-11-1233-2020, 2020.
Example plots
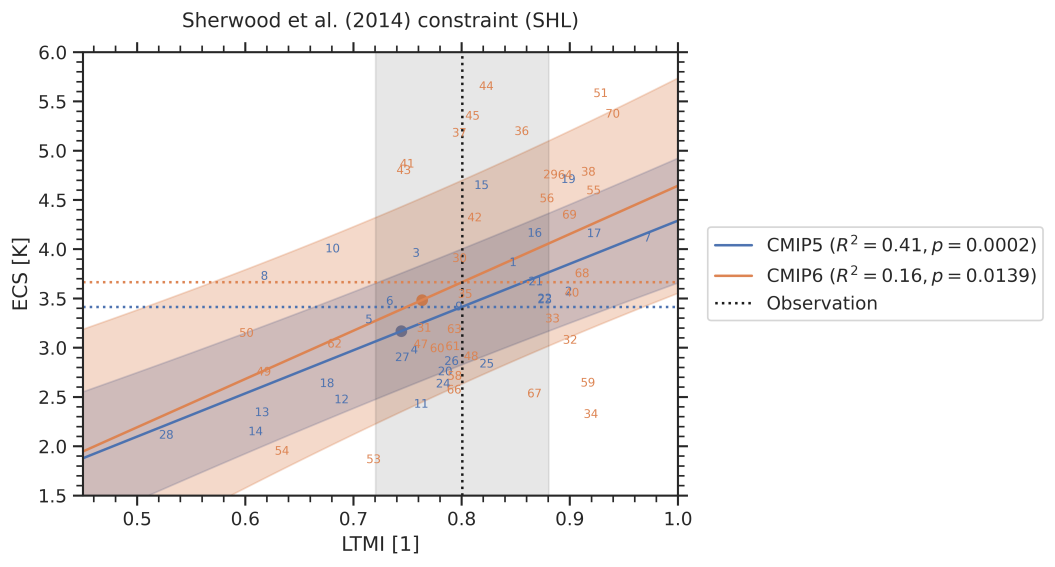
Fig. 99 Emergent relationship (solid blue and orange lines) of the Sherwood et al. (2014) emergent constraint, which is based on the lower tropospheric mixing index (LTMI). The numbers correspond to individual CMIP models. The shaded area around the regression line corresponds to the standard prediction error, which defines the error in the regression model itself. The vertical dashed black line corresponds to the observational reference with its uncertainty range given as standard error (gray shaded area). The horizontal dashed lines show the best estimates of the constrained ECS for CMIP5 (blue) and CMIP6 (orange). The colored dots mark the CMIP5 (blue) and CMIP6 (orange) multi-model means.
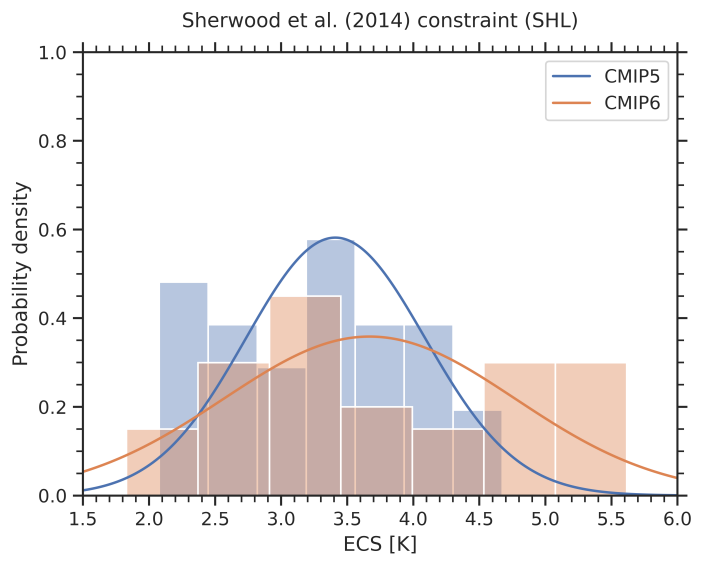
Fig. 100 Probability densities for the constrained ECS (solid lines) and the unconstrained model ensembles (histograms) of the emergent relationship shown in the figure above.
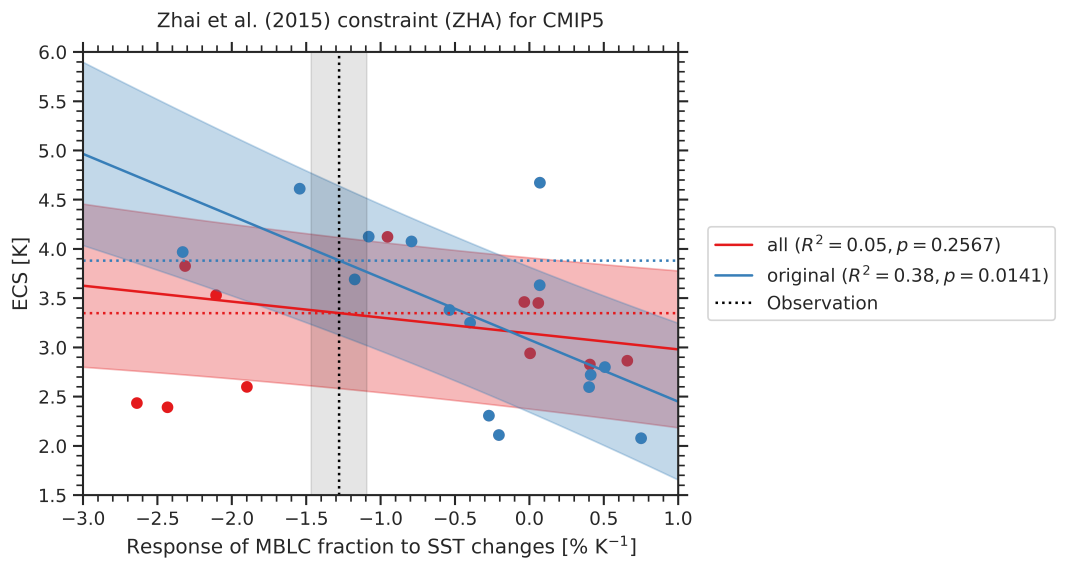
Fig. 101 Emergent relationship of the Zhai et al. (2015) emergent constraint for different subsets of CMIP5 models. Blue circles show the 15 CMIP5 models used in the original publication (except for CESM1-CAM5); the solid blue line and blue shaded area show the emergent relationships evaluated on these models including the uncertainty range. In this study, 11 more CMIP5 models have been added (red circles). The corresponding emergent relationship that considers all available CMIP5 models is shown in red colors. This relationship shows a considerably lower coefficient of determination (\(R^2\)) and higher p-value than the relationship using the original subset of CMIP5 models. The vertical dashed line and shaded area correspond to the observational reference, and the horizontal dashed lines show the corresponding ECS constraints using this observation.