Heat wave and cold wave duration
Overview
The goal of this diagnostic is to estimate the relative change in heat/cold wave characteristics in future climates compared to a reference period using daily maximum or minimum temperatures.
The user can select whether to compute the frequency of exceedances or non-exceedances, which corresponds to extreme high or extreme low temperature events, respectively. The user can also select the minimum duration for an event to be classified as a heat/cold wave and the season of interest.
The diagnostic calculates the number of days in which the temperature exceeds or does not exceeds the necessary threshold for a consecutive number of days in future climate projections. The result is an annual time series of the total number of heat/cold wave days for the selected season at each grid point. The final output is the average number of heat/cold wave days for the selected season in the future climate projections.
Available recipes and diagnostics
Recipes are stored in recipes/
recipe_heatwaves_coldwaves.yml
Diagnostics are stored in diag_scripts/magic_bsc/
extreme_spells.R: calculates the heatwave or coldwave duration.
User settings
User setting files are stored in recipes/
recipe_heatwaves_coldwaves.yml
Required settings for script
quantile: quantile defining the exceedance/non-exceedance threshold
min_duration: Min duration in days of a heatwave/coldwave event
Operator: either ‘>’ for exceedances or ‘<’ for non-exceedances
season: ‘summer’ or ‘winter
Variables
tasmax or tasmin (atmos, daily, longitude, latitude, time)
Observations and reformat scripts
None
References
Cardoso, S., Marta-Almeida, M., Carvalho, A.C., & Rocha, A. (2017). Heat wave and cold spell changes in Iberia for a future climate scenario. International Journal of Climatology, 37(15), 5192-5205. https://doi.org/10.1002/joc.5158
Ouzeau, G., Soubeyroux, J.-M., Schneider, M., Vautard, R., & Planton, S. (2016). Heat waves analysis over France in present and future climate: Application of a new method on the EURO-CORDEX ensemble. Climate Services, 4, 1-12. https://doi.org/10.1016/J.CLISER.2016.09.002
Wang, Y., Shi, L., Zanobetti, A., & Schwartz, J. D. (2016). Estimating and projecting the effect of cold waves on mortality in 209 US cities. Environment International, 94, 141-149. https://doi.org/10.1016/j.envint.2016.05.008
Zhang, X., Hegerl, G., Zwiers, F. W., & Kenyon, J. (2005). Avoiding inhomogeneity in percentile-based indices of temperature extremes. Journal of Climate, 18(11), 1641-1651. https://doi.org/10.1175/JCLI3366.1
Example plots
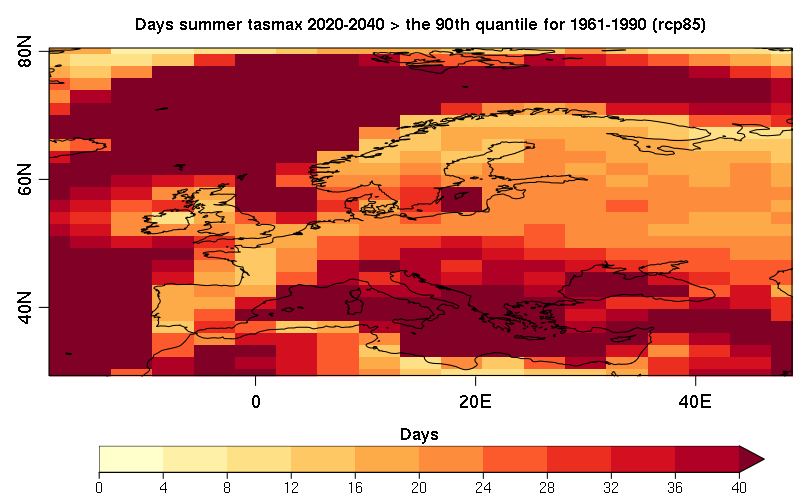
Mean number of summer days during the period 2060-2080 when the daily maximum near-surface air temperature exceeds the 80th quantile of the 1971-2000 reference period. The results are based on one RCP 8.5 scenario simulated by BCC-CSM1-1.