Runoff, Precipitation, Evapotranspiration
Overview
This diagnostic calculates biases of long-term climatological annual means of total runoff R, precipitation P and evapotranspiration E for 12 large-scale catchments on different continents and climates. For total runoff, catchment averaged model values are compared to climatological GRDC station observations of river runoff (Duemenil Gates et al., 2000). Due to the incompleteness of these station data, a year-to-year correspondence of data cannot be achieved in a generalized way, so that only climatological data are considered, such it has been done in Hagemann, et al. (2013). For precipitation, catchment-averaged WFDEI precipitation data (Weedon et al., 2014) from 1979-2010 is used as reference. For evapotranspiration, observations are estimated using the difference of the above mentioned precipitation reference minus the climatological GRDC river runoff.
The catchments are Amazon, Congo, Danube, Ganges-Brahmaputra, Lena, Mackenzie, Mississippi, Murray, Niger, Nile, Parana and Yangtze-Kiang. Variable names are expected to follow CMOR standard, e.g. precipitation as pr, total runoff as mrro and evapotranspiration as evspsbl with all fluxes given in kg m-2 s-1 . Evapotranspiration furthermore has to be defined positive upwards.
The diagnostic produces text files with absolute and relative bias to the observations, as well as the respective absolute values. Furthermore it creates a bar plot for relative and absolute bias, calculates and plots biases in runoff coefficient (R/P) and evapotranspiration coefficient (E/P) and saves everything as one pdf file per model or one png file per model and analysis.
The bias of the runoff coefficient is calculated via: \(C_R = \frac{R_{model}}{P_{model}} - \frac{R_{GRDC}}{P_{WFDEI}}\) and similar for the evapotranspiration coefficient. In a very first approximation, evapotranspiration and runoff are determined only by precipitation. In other words \(R = P - E\). Hence, the runoff coefficient (and similar the evapotranspiration coefficient) tells you how important runoff (or evapotranspiration) is in this region. By plotting the bias of the runoff coefficient against the evapotranspiration coefficient we can immediately see whether there is a shift from runoff to evapotranspiration. On the other hand, by plotting the bias of the runoff coefficient against the relative bias of precipitation we can see whether an error in runoff is due to an error in precipitation.
Available recipes and diagnostics
Recipes are stored in recipes/
recipe_runoff_et.yml
Diagnostics are stored in diag_scripts/runoff_et/
catchment_analysis.py: bar and scatter plots for catchment averages of runoff, evapotranspiration and precipitation
User settings in recipe
Script catchment_analysis.py
Required settings (scripts)
catchmentmask: netCDF file indicating the grid cell for a specific catchment. Modus of distribution not yet clearified. ESGF?
Optional settings (variables)
reference_dataset: dataset_name Datasets can be used as reference instead of defaults provided with the diagnostics. Must be identical for all variables.
Variables
evspsbl (atmos, monthly mean, time latitude longitude)
pr (atmos, monthly mean, time latitude longitude)
mrro (land, monthly mean, time latitude longitude)
Observations and reformat scripts
Default reference data based on GRDC and WFDEI are included in the diagnostic script as catchment averages. They can be replaced with any gridded dataset by defining a reference_dataset. The necessary catchment mask is available at
All other datasets are remapped onto the catchment mask grid as part of the diagnostics.
References
Duemenil Gates, L., S. Hagemann and C. Golz, Observed historical discharge data from major rivers for climate model validation. Max Planck Institute for Meteorology Report 307, Hamburg, Germany, 2000.
Hagemann, S., A. Loew, A. Andersson, Combined evaluation of MPI-ESM land surface water and energy fluxes J. Adv. Model. Earth Syst., 5, doi:10.1029/2012MS000173, 2013.
Weedon, G. P., G. Balsamo, N. Bellouin, S. Gomes, M. J. Best, and P. Viterbo, The WFDEI meteorological forcing data set: WATCH Forcing Data methodology applied to ERA‐Interim reanalysis data, Water Resour. Res., 50, 7505–7514, doi: 10.1002/2014WR015638, 2014
Example plots
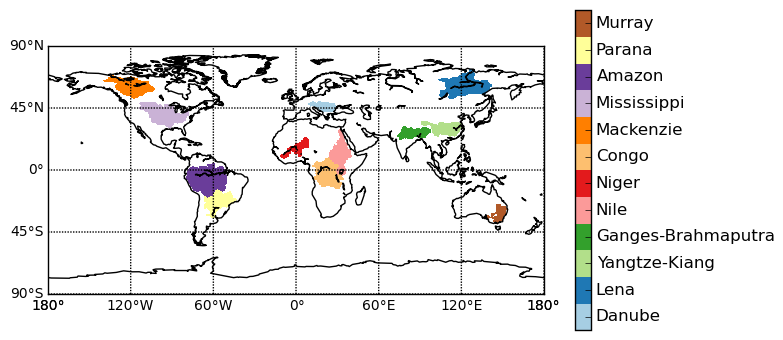
Fig. 125 Catchment definitions used in the diagnostics.
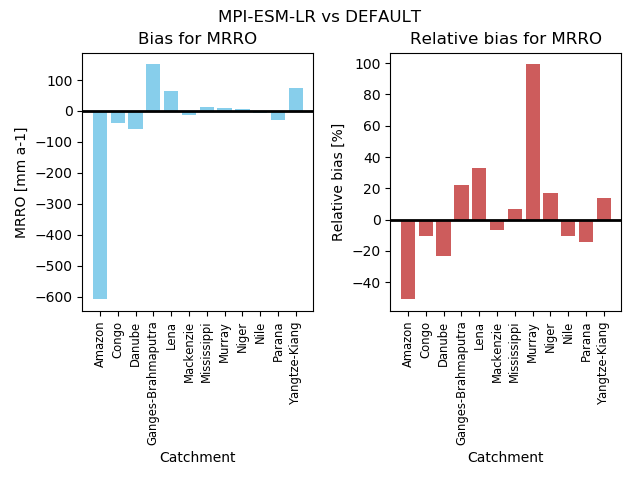
Fig. 126 Barplot indicating the absolute and relative bias in annual runoff between MPI-ESM-LR (1970-2000) and long term GRDC data for specific catchments.
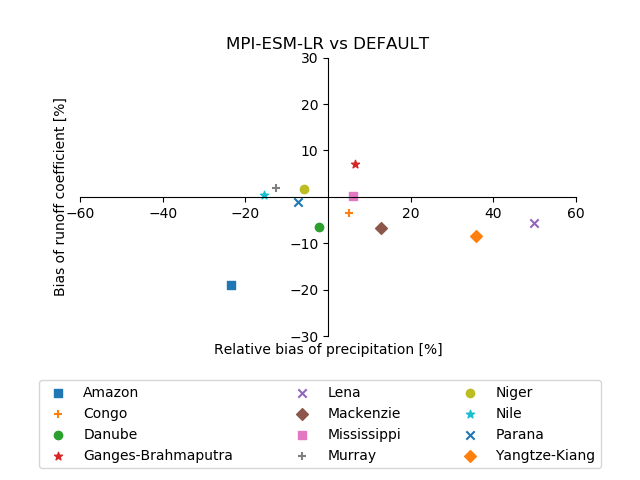
Fig. 127 Biases in runoff coefficient (runoff/precipitation) and precipitation for major catchments of the globe. The MPI-ESM-LR historical simulation (1970-2000) is used as an example.