Diagnostics of stratospheric dynamics and chemistry
Overview
This recipe reproduces the figures of Eyring et al. (2006) The following plots are reproduced:
Vertical profile climatological mean bias of climatological mean for selected seasons and latitudinal region.
Vertical and latitudinal profile of climatological mean for selected seasons this figure and setting is valid for figure 5 (CH4) figure 6 (H2O) figure 11 (HCL) figure 13 (tro3).
Total ozone anomalies at different latitudinal band and seasons.
Available recipes and diagnostics
Recipes are stored in esmvaltool/recipes/
recipe_eyring06jgr.yml
Diagnostics are stored in esmvaltool/diag_scripts/eyring06jgr/
eyring06jgr_fig01.ncl
eyring06jgr_fig05a.ncl
eyring06jgr_fig05b.ncl
eyring06jgr_fig15.ncl
User settings in recipe
Preprocessor
regrid_interp_lev_zonal: Regridding and interpolation reference_dataset levels used by eyring06jgr_fig01 and eyring06jgr_fig05zonal: Regridding and zonal mean used by eyring06jgr_fig15
Script <eyring06jgr_fig01.ncl>
Required settings for script
latmin: array of float, min lat where variable is averaged, i.e. [60., 60., -90., -90. ]latmax: array of float,and max lat where variable is averaged, i.e. [90., 90., -60., -60. ]season: array of string., season when variable is averaged, i.e. [“DJF”, “MAM”, “JJA”, “SON”]XMin: array of float, min limit X axis [-30., -30., -30., -30.]XMax: array of float, max limit X axis [20., 20., 20., 20.]levmin: array of float, min limit Y axis [1., 1., 1., 1.]levmax: array of float, max limit Y axis [350., 350., 350., 350.]
Optional settings for script
start_year: int, year when start the climatology calculation [1980] (default max among the models start year).end_year:int, year when end the climatology calculation [1999] (default min among the models end year).multimean: bool, calculate multi-model mean, (i.e. False/True) (default False).
Required settings for variables
preprocessor: regrid_interp_lev.reference_dataset: name of the reference model or observation for regridding and bias calculation (e.g. ERA-Interim”).mip: Amon.
Variables
ta (atmos, monthly mean, longitude latitude level time)
Example plots
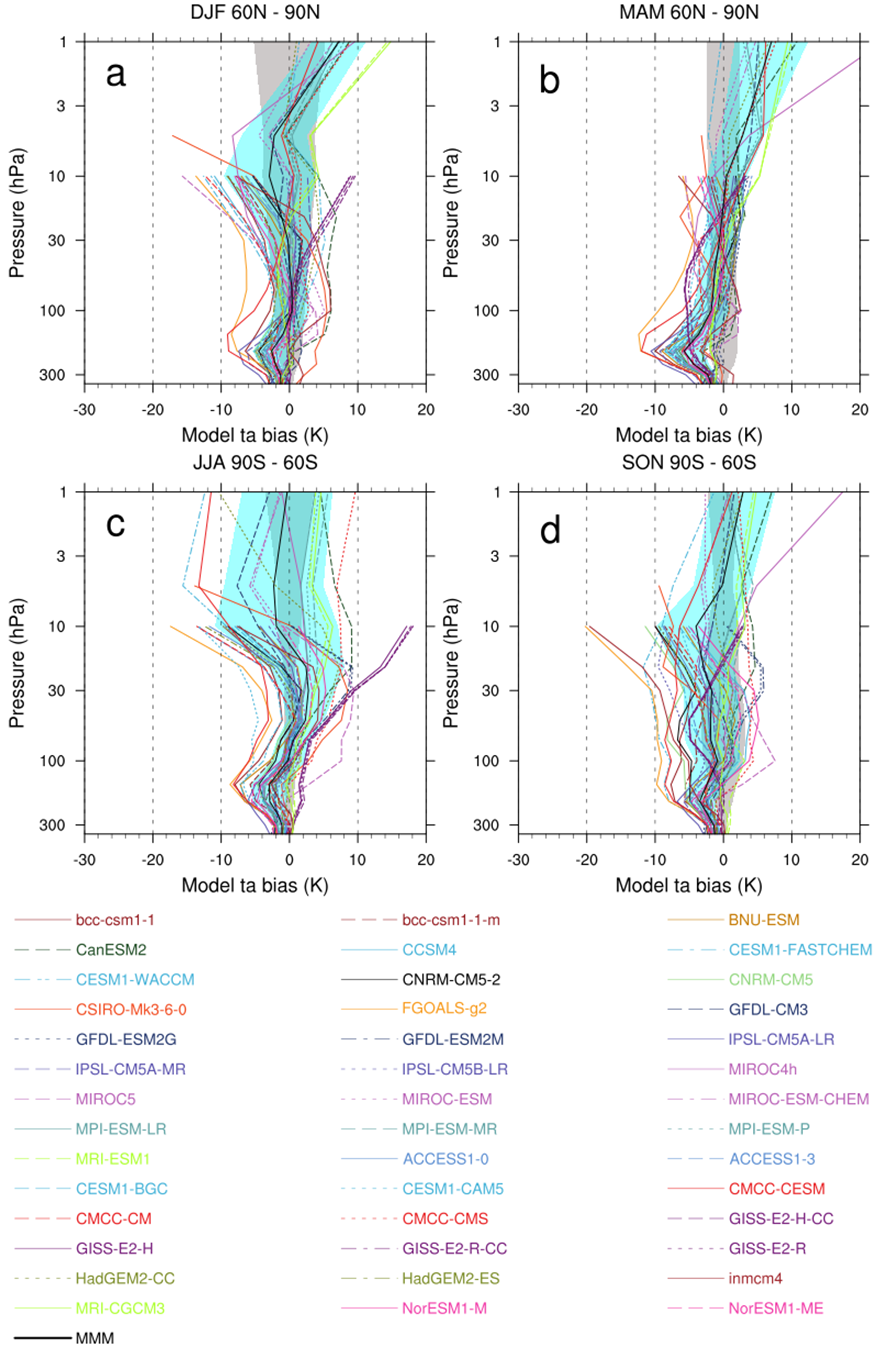
Fig. 22 Climatological mean temperature biases for (top) 60–90N and (bottom) 60–90S for the (left) winter and (right) spring seasons. The climatological means for the CCMs and ERA-Interim data from 1980 to 1999 are included. Biases are calculated relative to ERA-Interim reanalyses. The grey area shows ERA-Interim plus and minus 1 standard deviation (s) about the climatological mean. The turquoise area shows plus and minus 1 standard deviation about the multi-model mean.