ClimWIP: independence & performance weighting
Overview
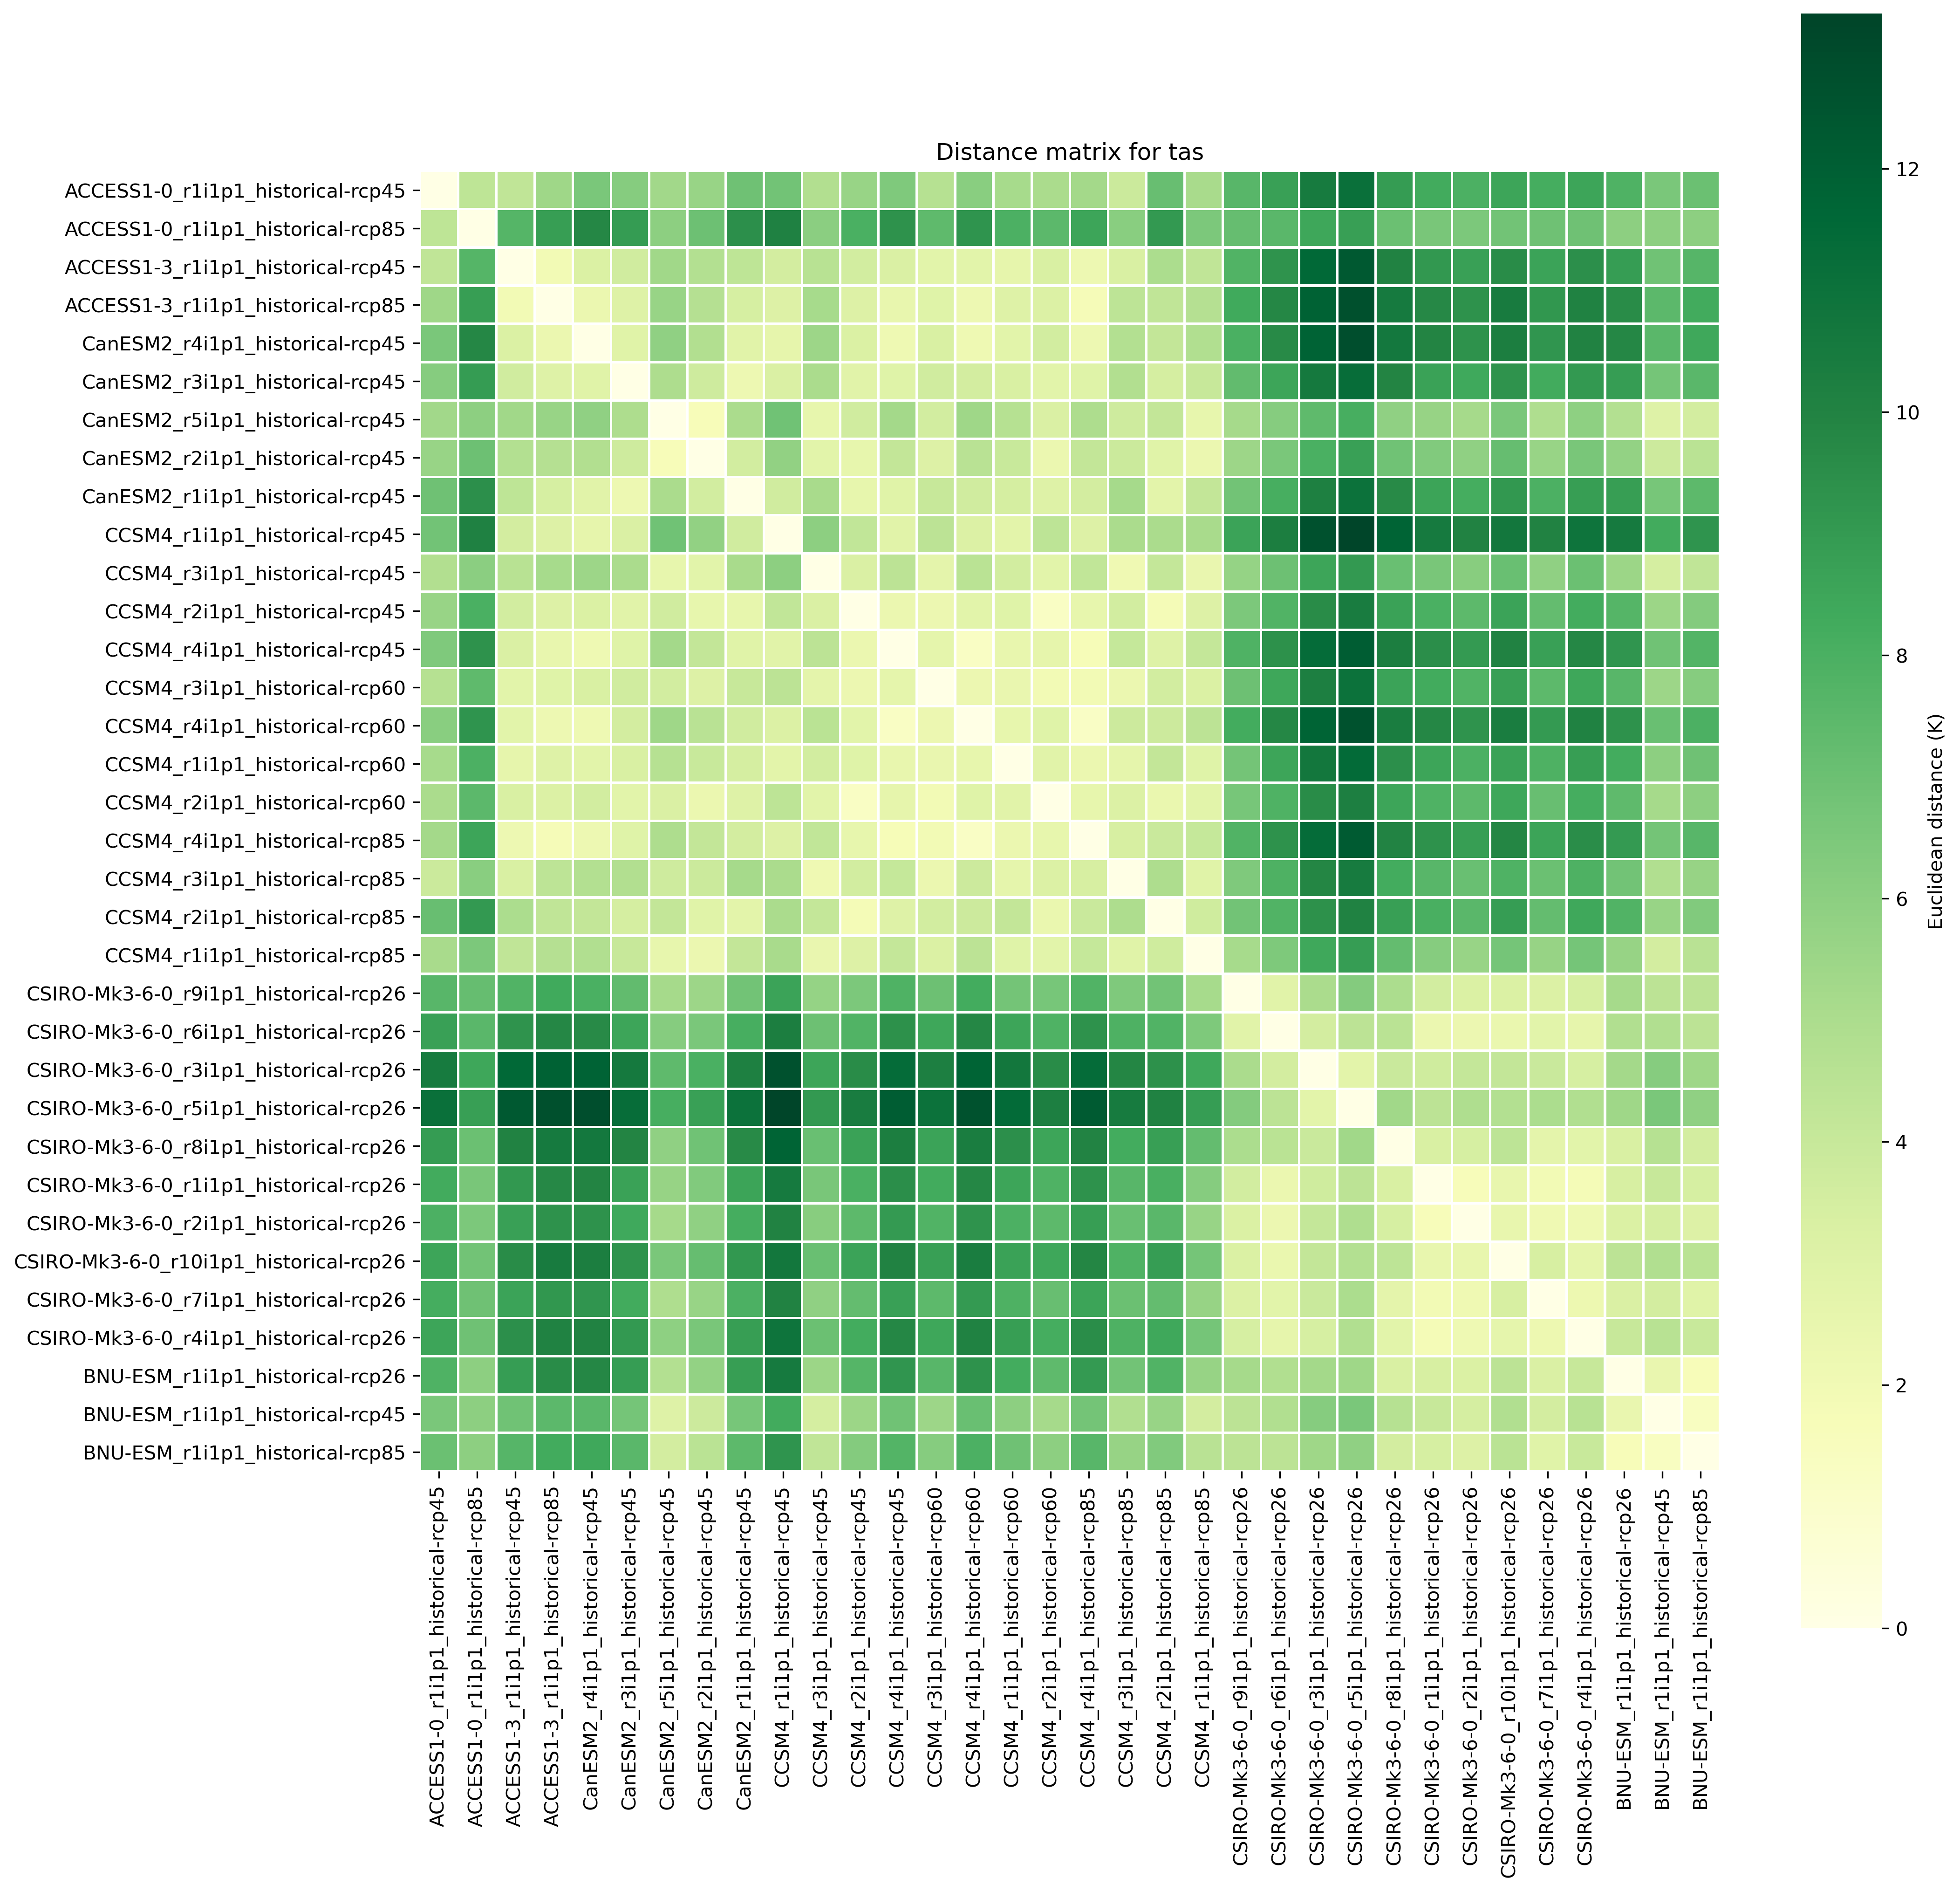
This recipe calculates weights based on combined performance and independence metrics. These weights can be used in subsequent diagnostics. Reference implementation based on https://github.com/lukasbrunner/ClimWIP
Available recipes and diagnostics
Recipes are stored in esmvaltool/recipes/
recipe_climwip.yml
Diagnostics are stored in esmvaltool/diag_scripts/weighting/
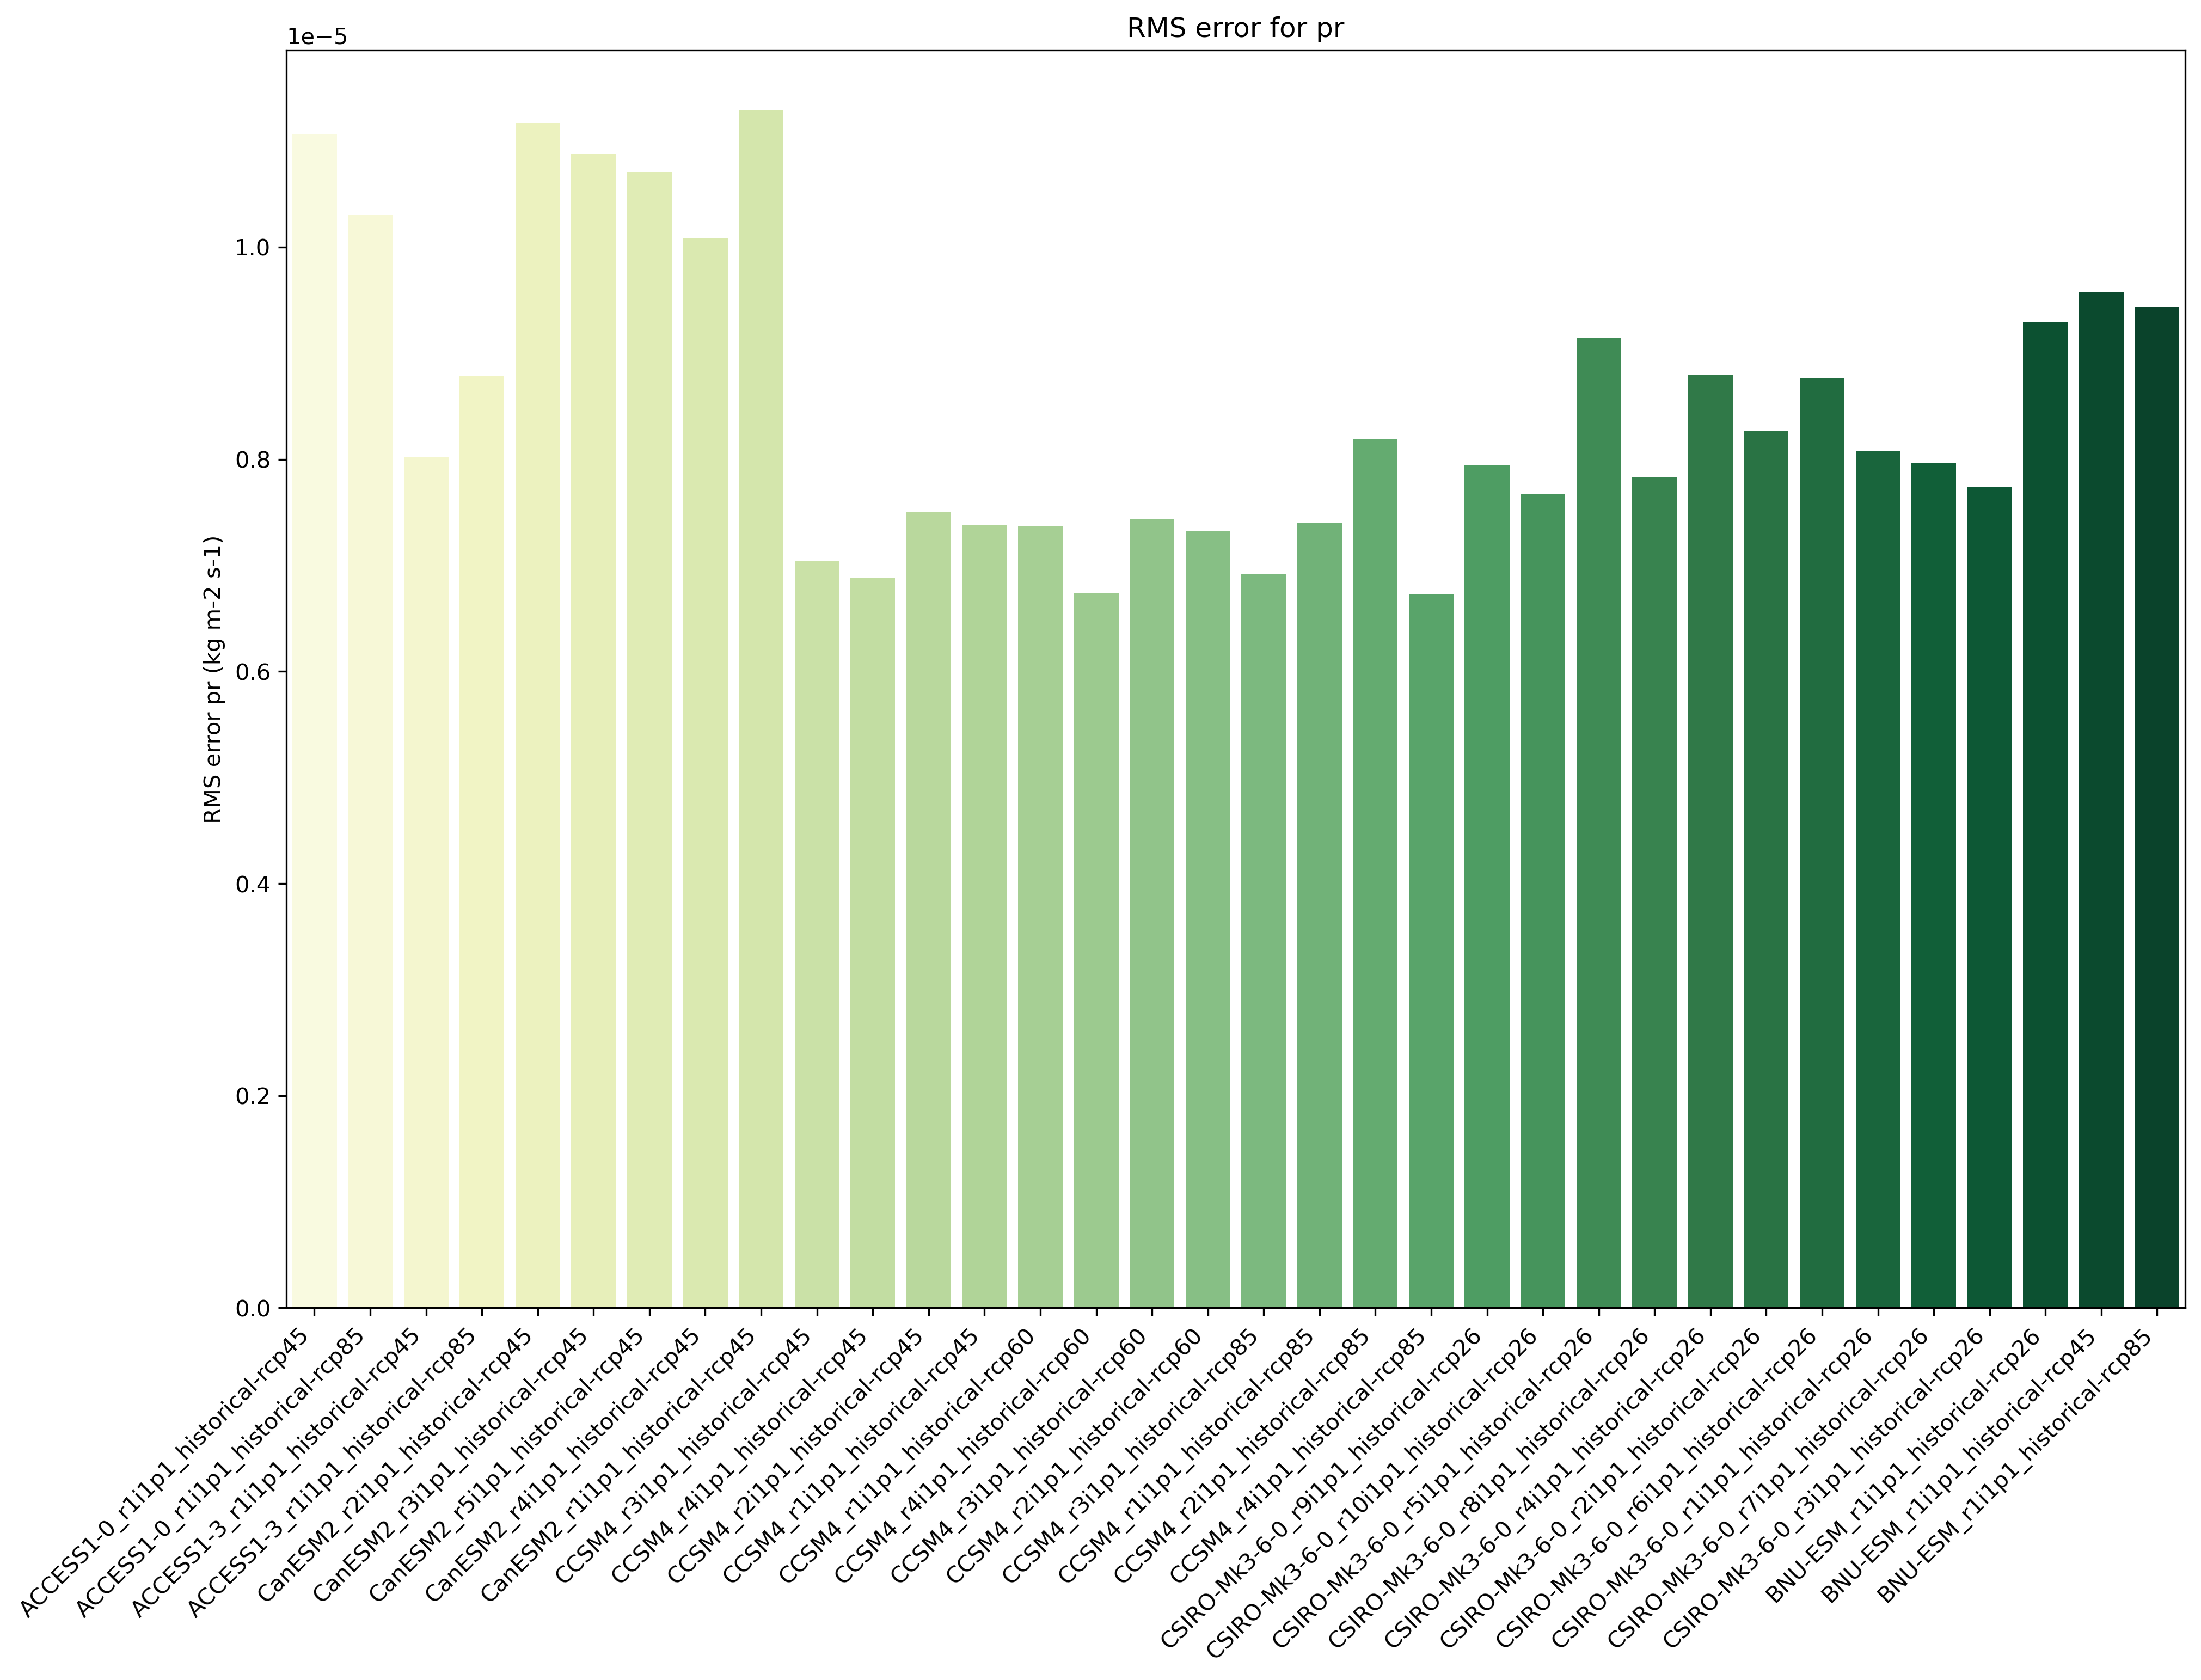
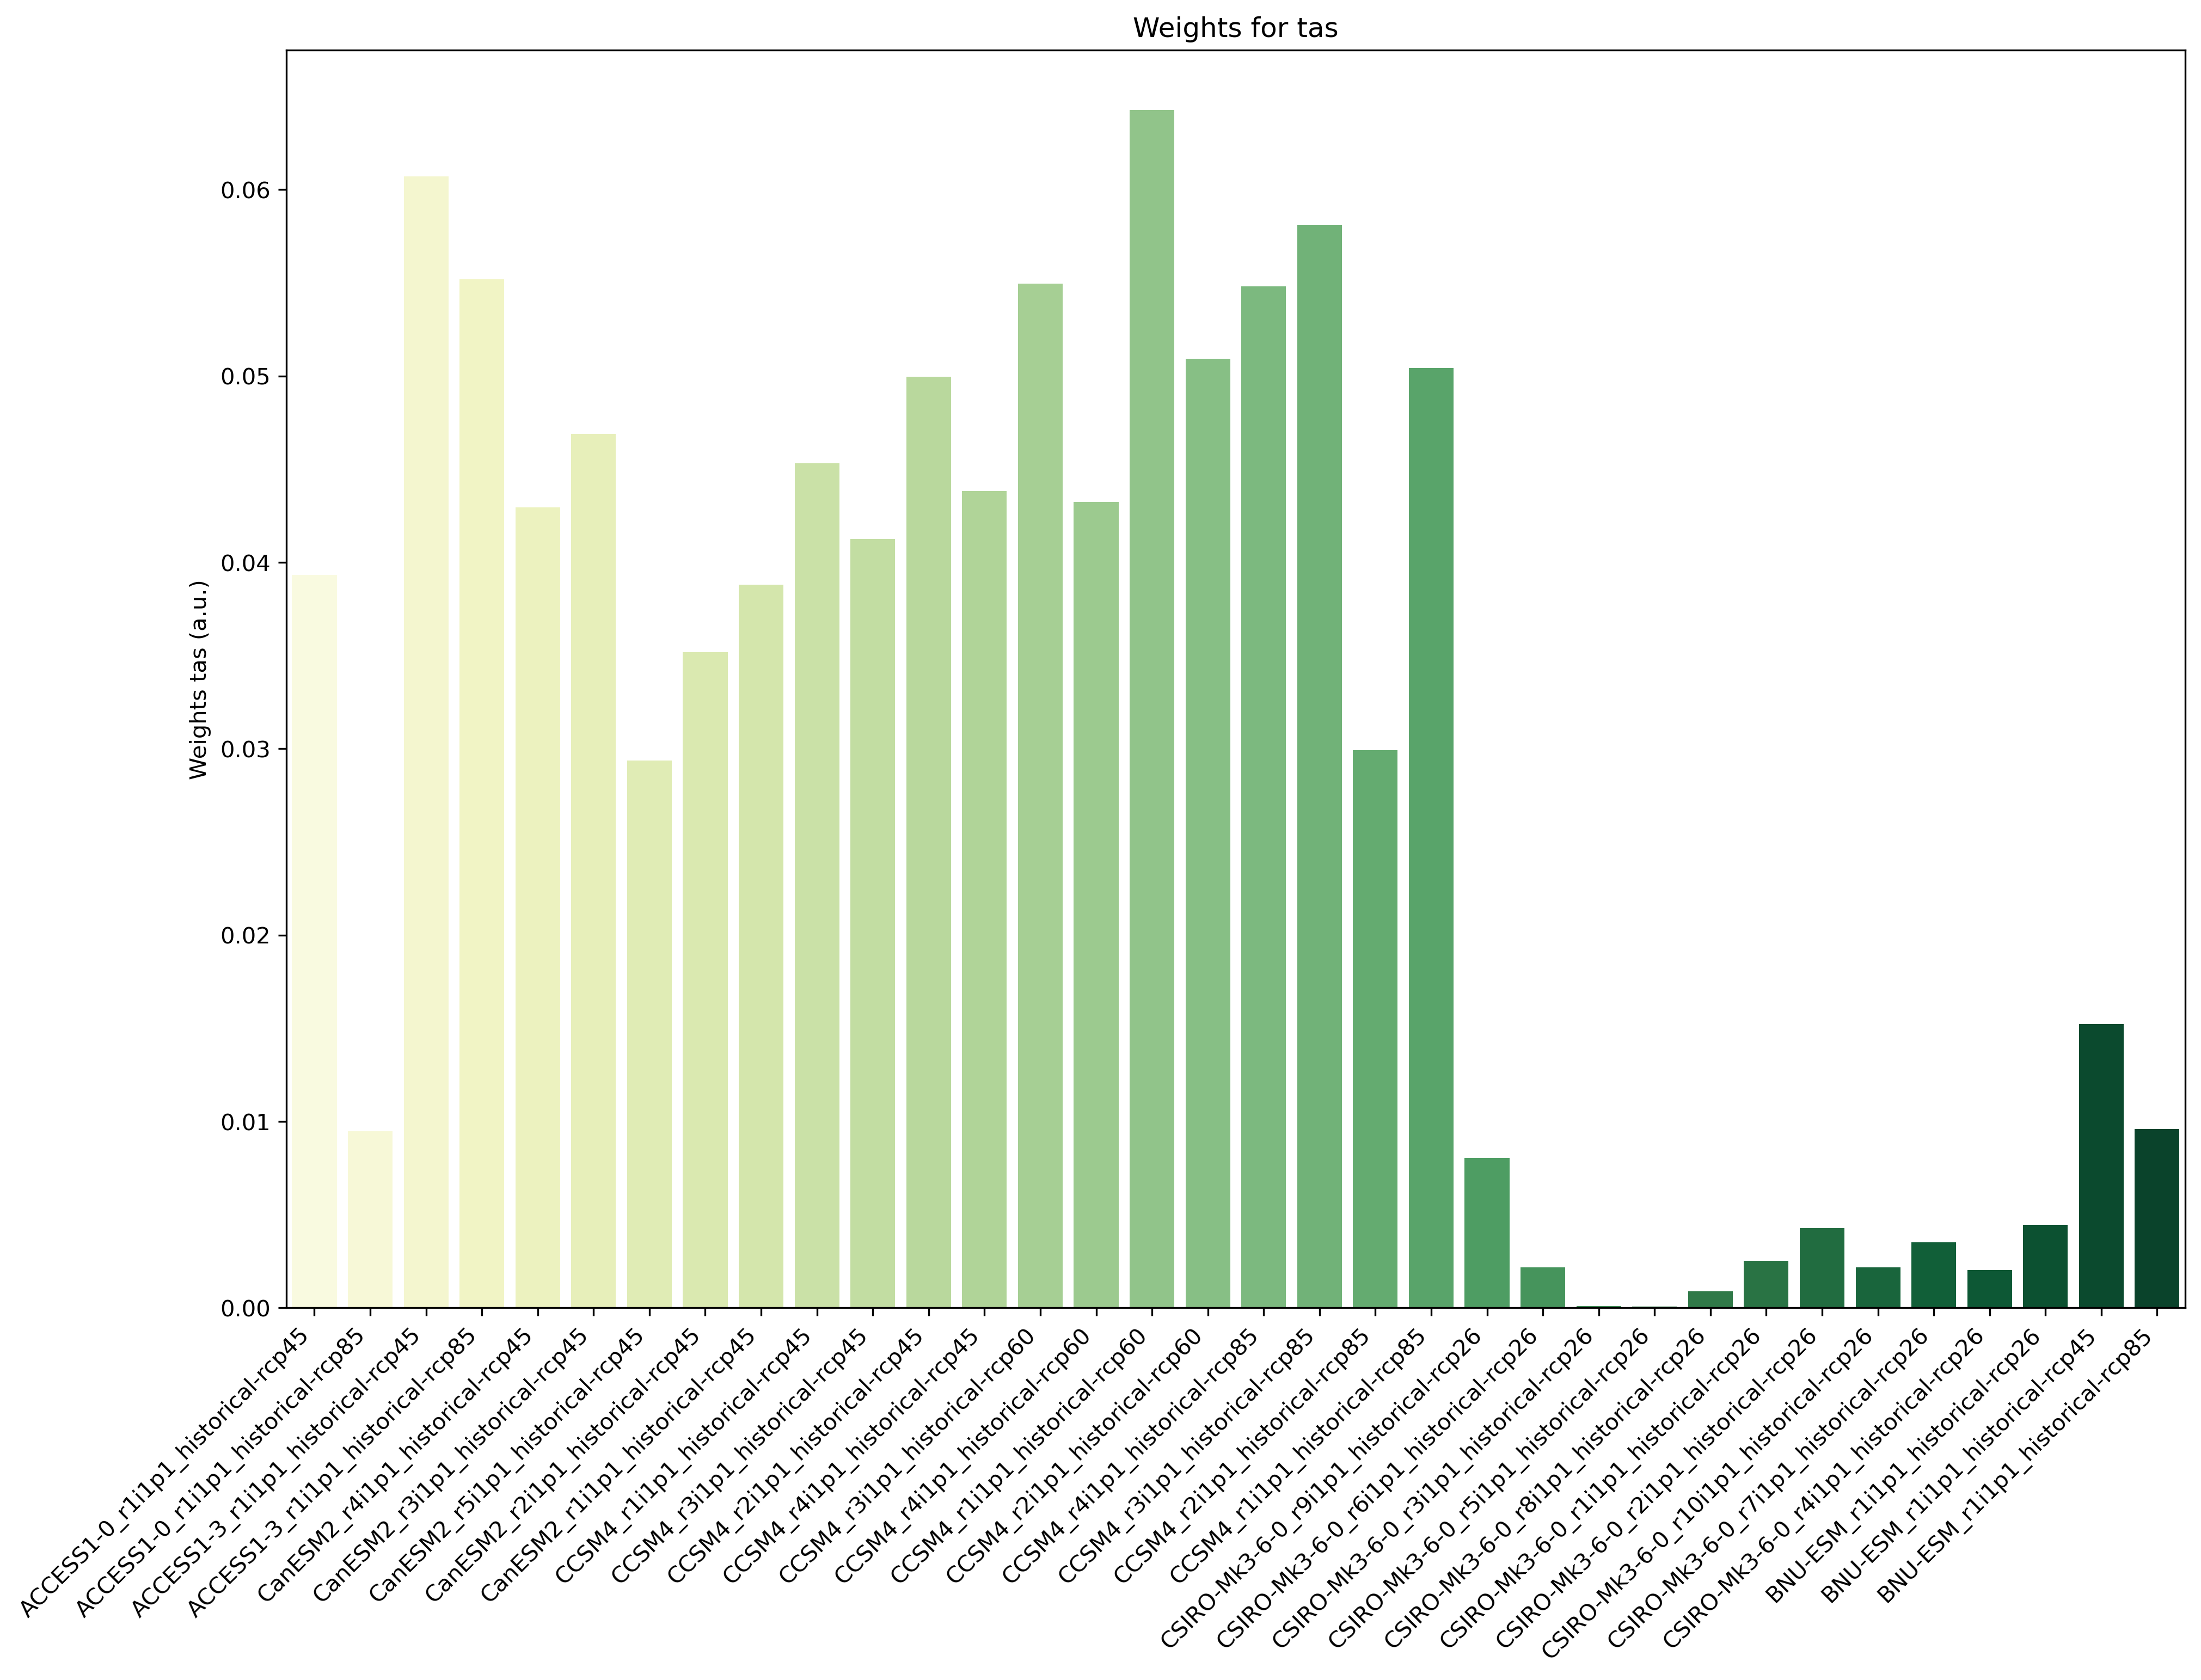
climwip.py: Compute weights for each input dataset
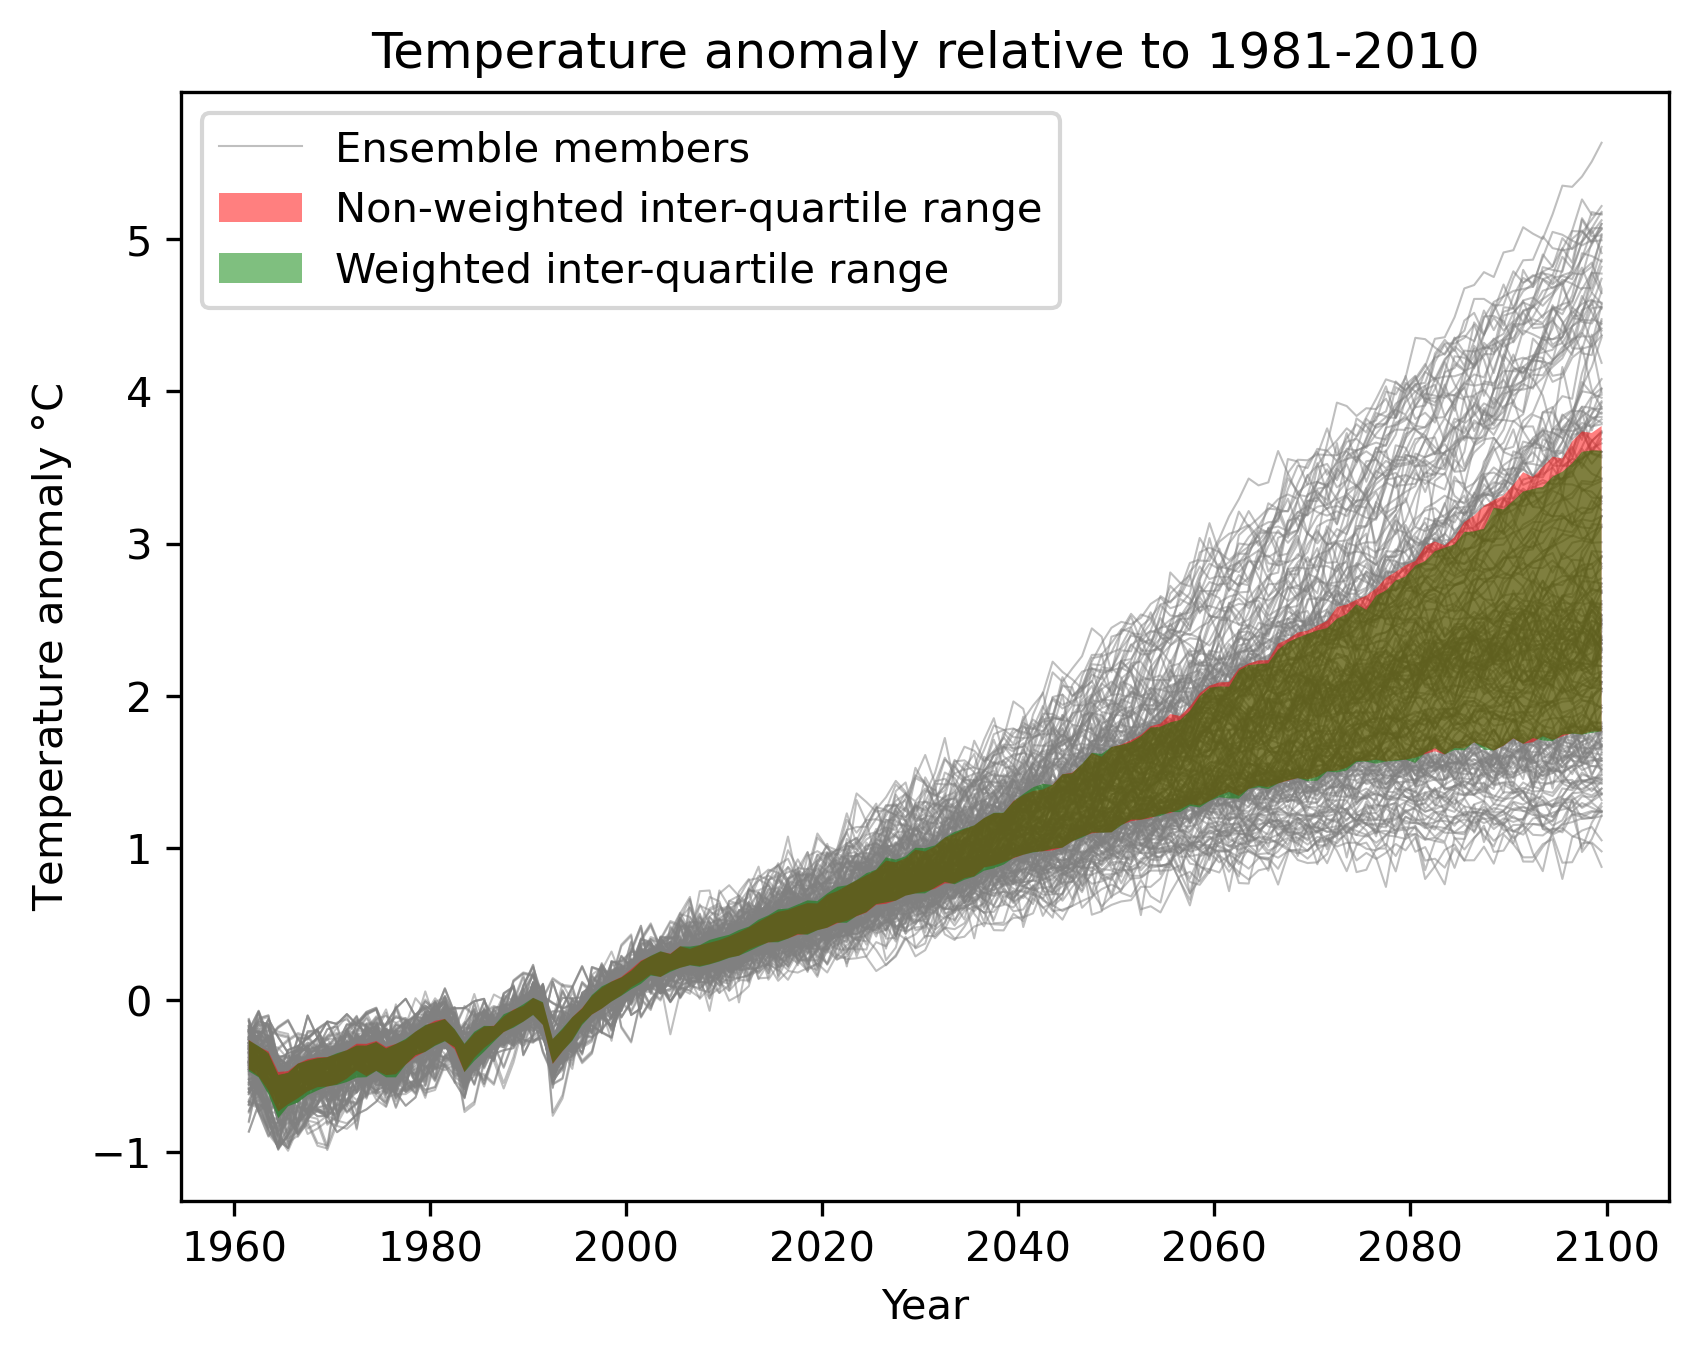
weighted_temperature_graph.py: Show the difference between weighted and non-weighted temperature anomalies.
User settings in recipe
Script
climwip.py
- Required settings for script
sigma_performance: shape parameter weights calculation (determined offline)
sigma_independence: shape parameter for weights calculation (determined offline)
obs_data: list of project names to specify which are the the observational data. The rest is assumed to be model data.- Required settings for variables
This script takes multiple variables as input as long as they’re available for all models
start_year: provide the period for which to compute performance and independence.
end_year: provide the period for which to compute performance and independence.
mip: typically Amon
preprocessor: e.g. climwip_summer_mean
additional_datasets: provide a list of model data for performance calculation.- Optional settings for variables
performance: set to false to not calculate performance for this variable group
independence: set to false to not calculate independence for this variable groupBy default, both performance and independence are calculate for each variable group.
- Required settings for preprocessor
Different combinations of preprocessor functions can be used, but the end result should always be aggregated over the time dimension, i.e. the input for the diagnostic script should be 2d (lat/lon).
- Optional settings for preprocessor
extract_regionorextract_shapecan be used to crop the input data.
extract_seasoncan be used to focus on a single season.different climate statistics can be used to calculate mean or (detrended) std_dev.
Script
weighted_temperature_graph.py
- Required settings for script
ancestors: must include weights from previous diagnostic
weights: the filename of the weights: ‘weights_combined.nc’- Required settings for variables
This script only takes temperature (tas) as input
start_year: provide the period for which to plot a temperature change graph.
end_year: provide the period for which to plot a temperature change graph.
mip: typically Amon
preprocessor: temperature_anomalies- Required settings for preprocessor
Different combinations of preprocessor functions can be used, but the end result should always be aggregated over the latitude and longitude dimensions, i.e. the input for the diagnostic script should be 1d (time).
- Optional settings for preprocessor
Can be a global mean or focus on a point, region or shape
Anomalies can be calculated with respect to a custom reference period
Monthly, annual or seasonal average/extraction can be used
Variables
pr (atmos, monthly mean, longitude latitude time)
tas (atmos, monthly mean, longitude latitude time)
more variables can be added if available for all datasets.
Observations and reformat scripts
Observation data is defined in a separate section in the recipe and may include multiple datasets.