Hydro forcing comparison
Overview
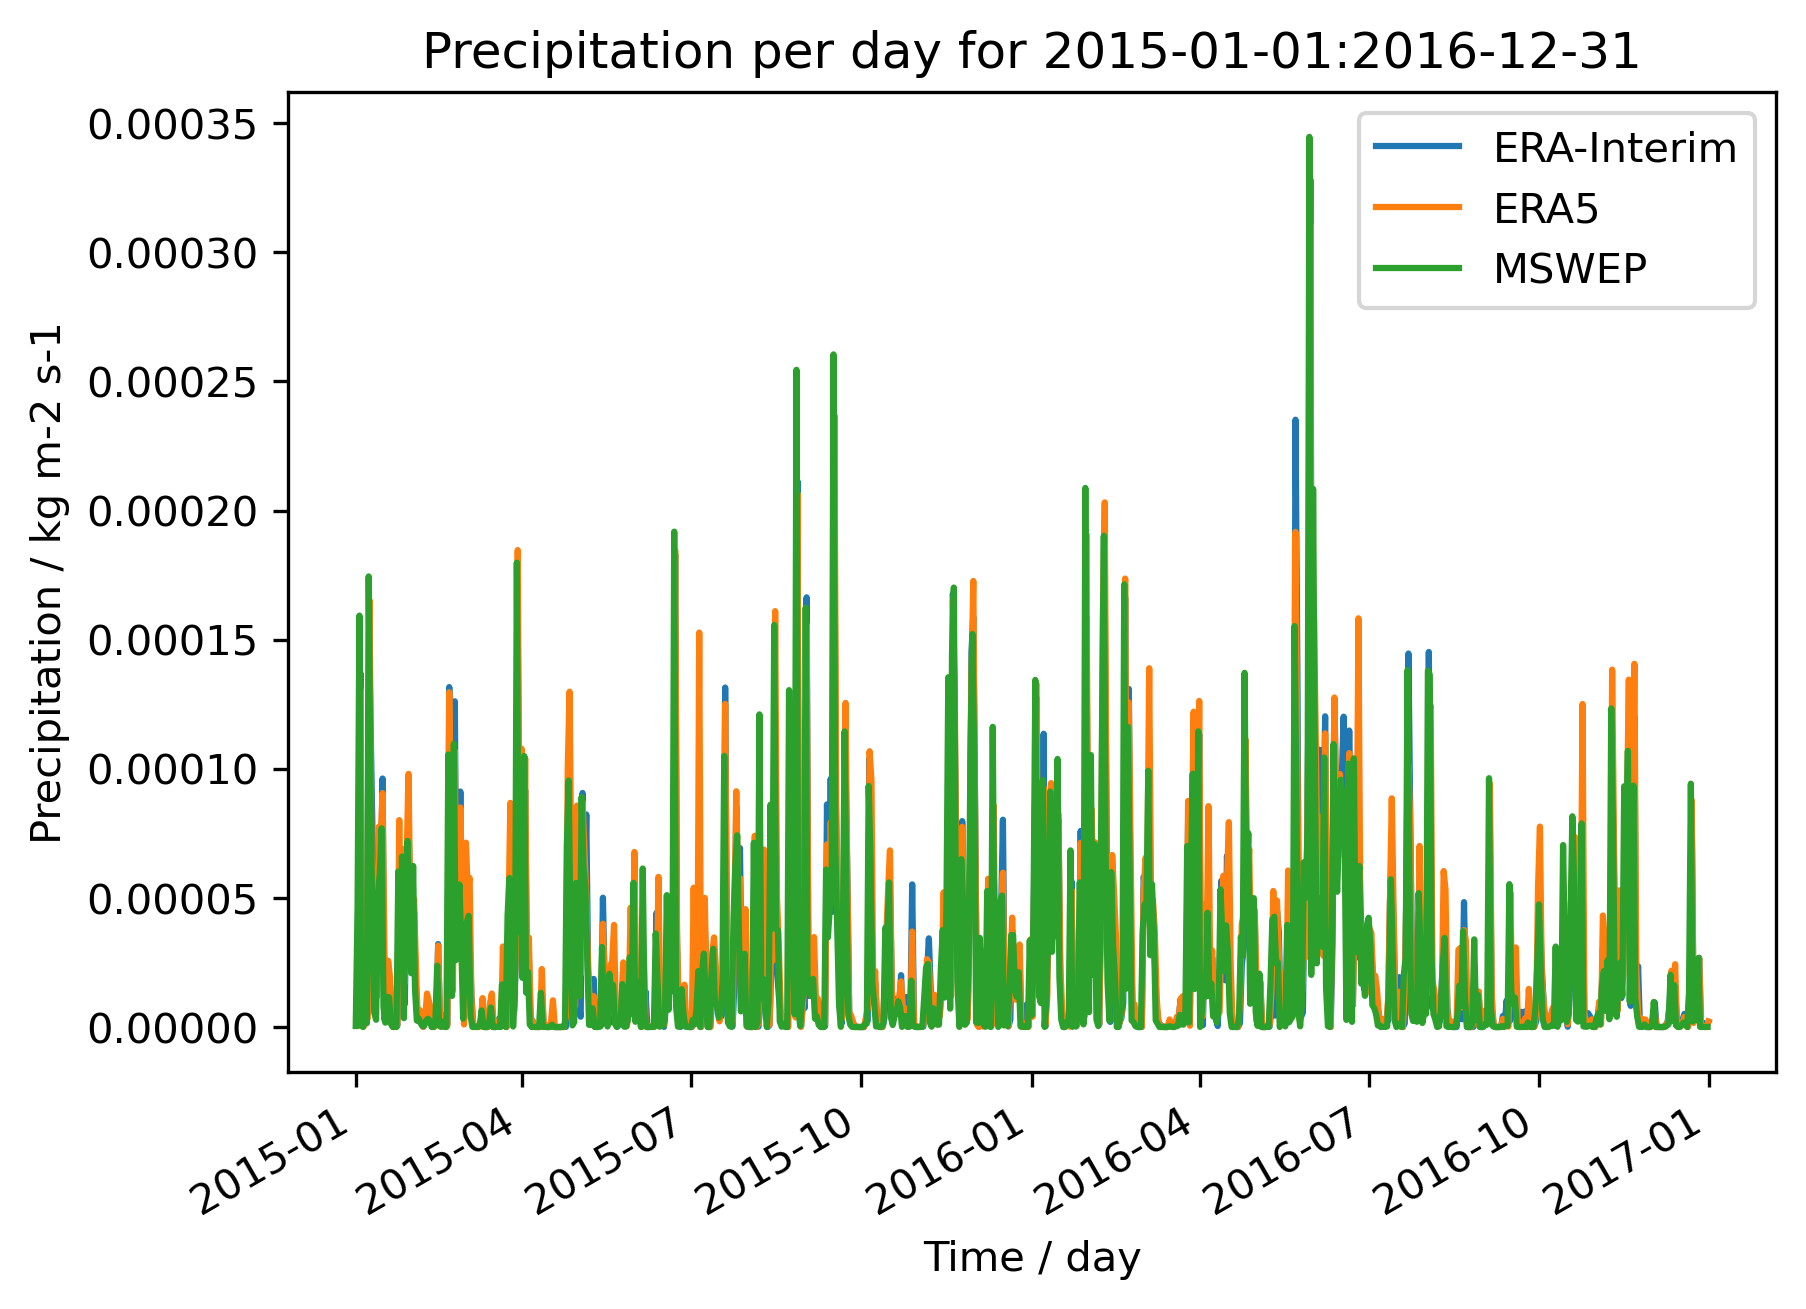
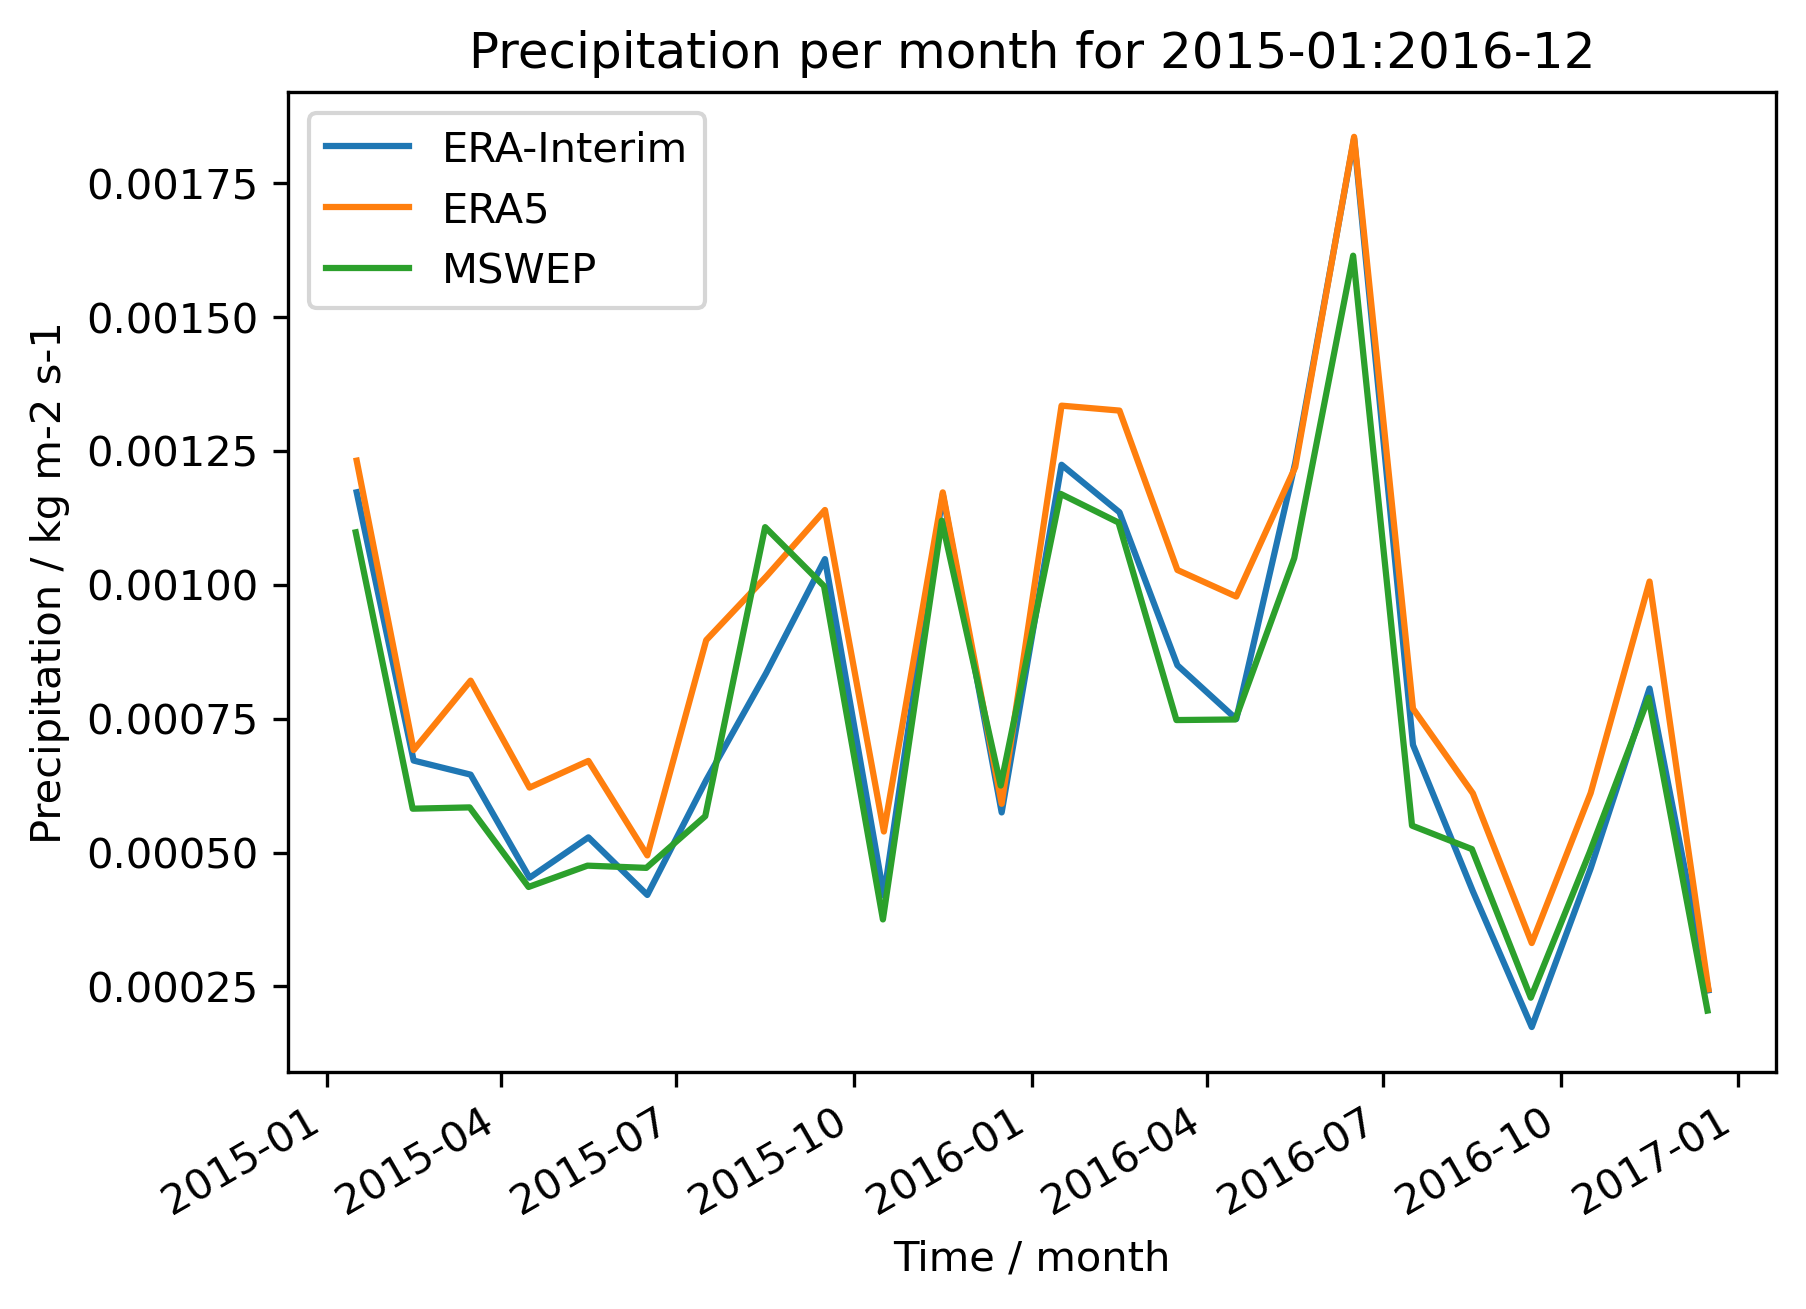
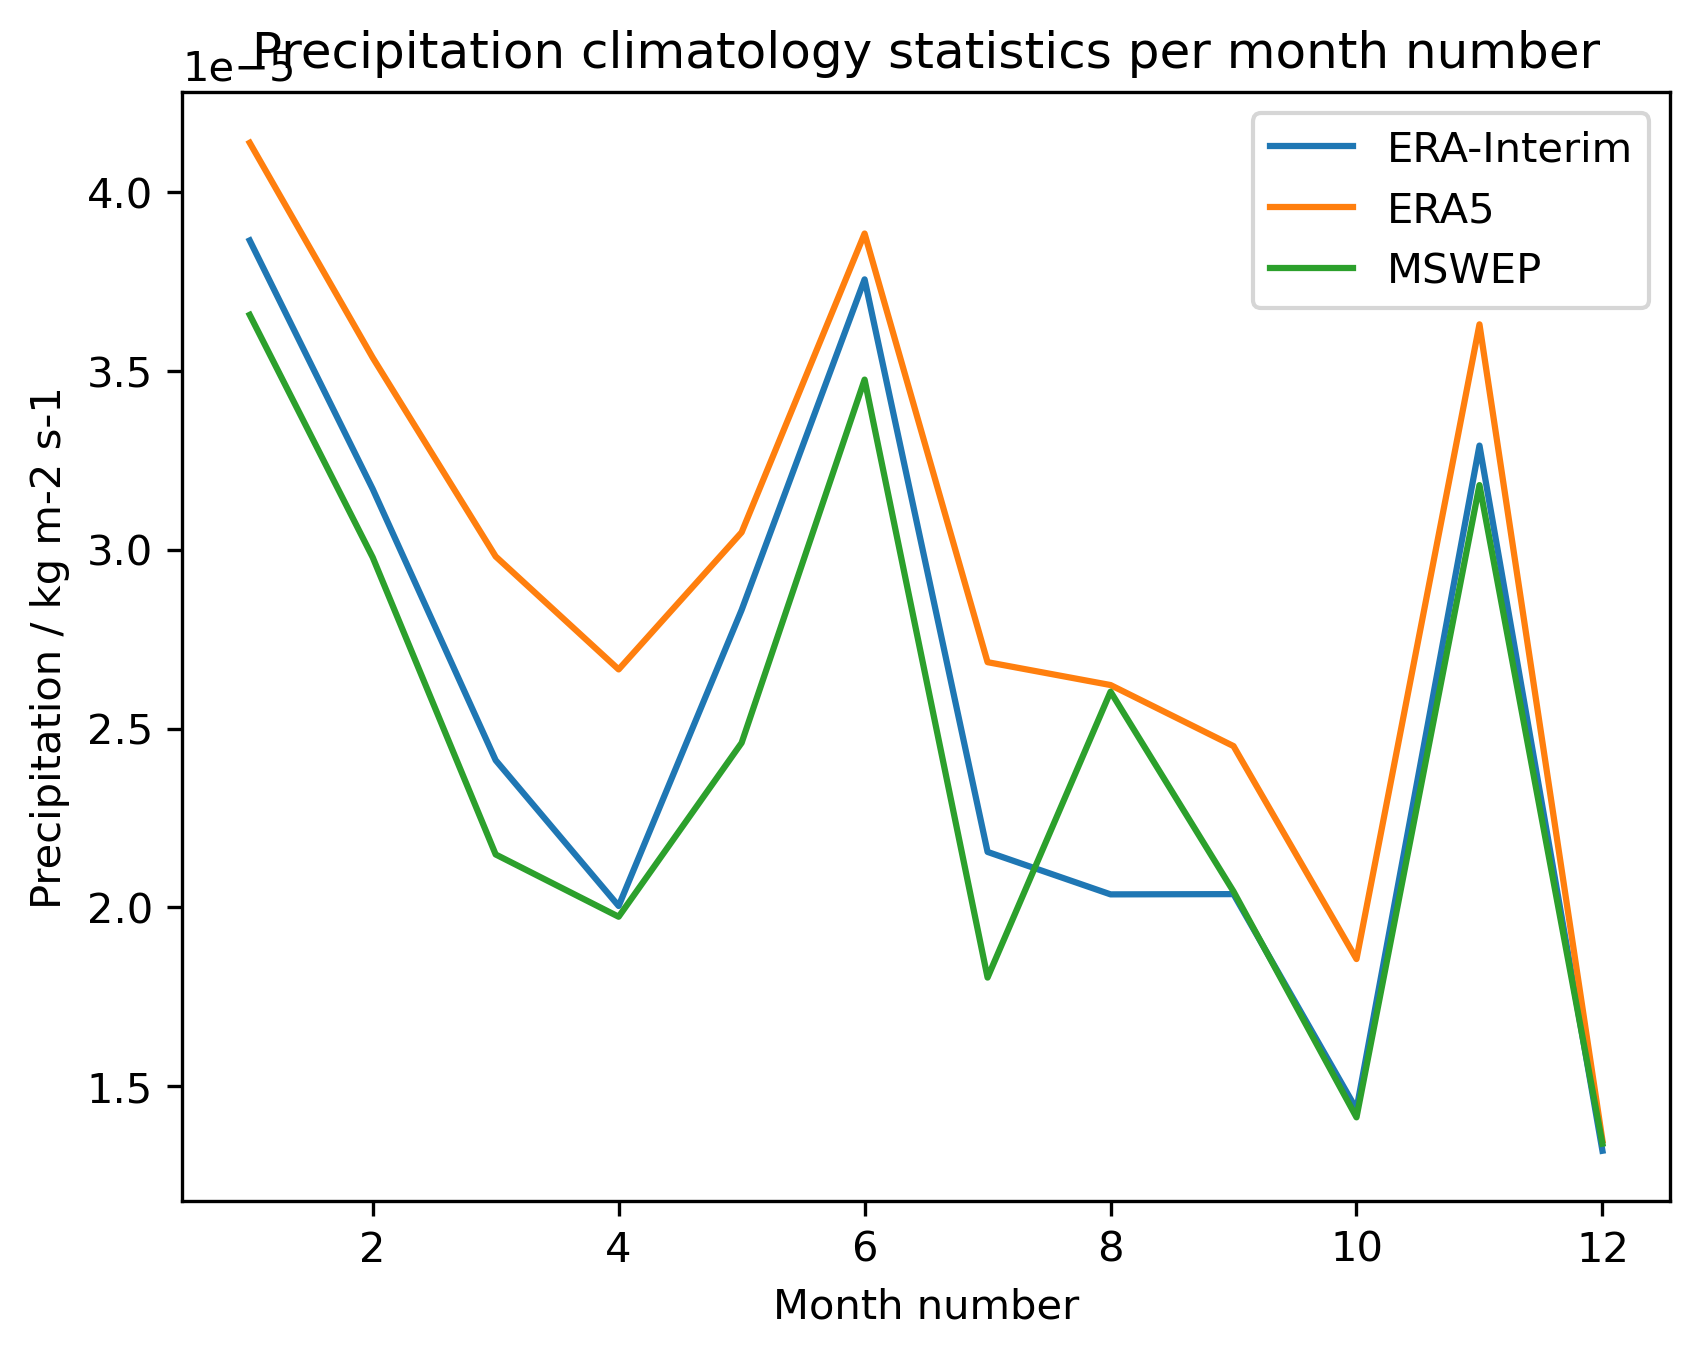
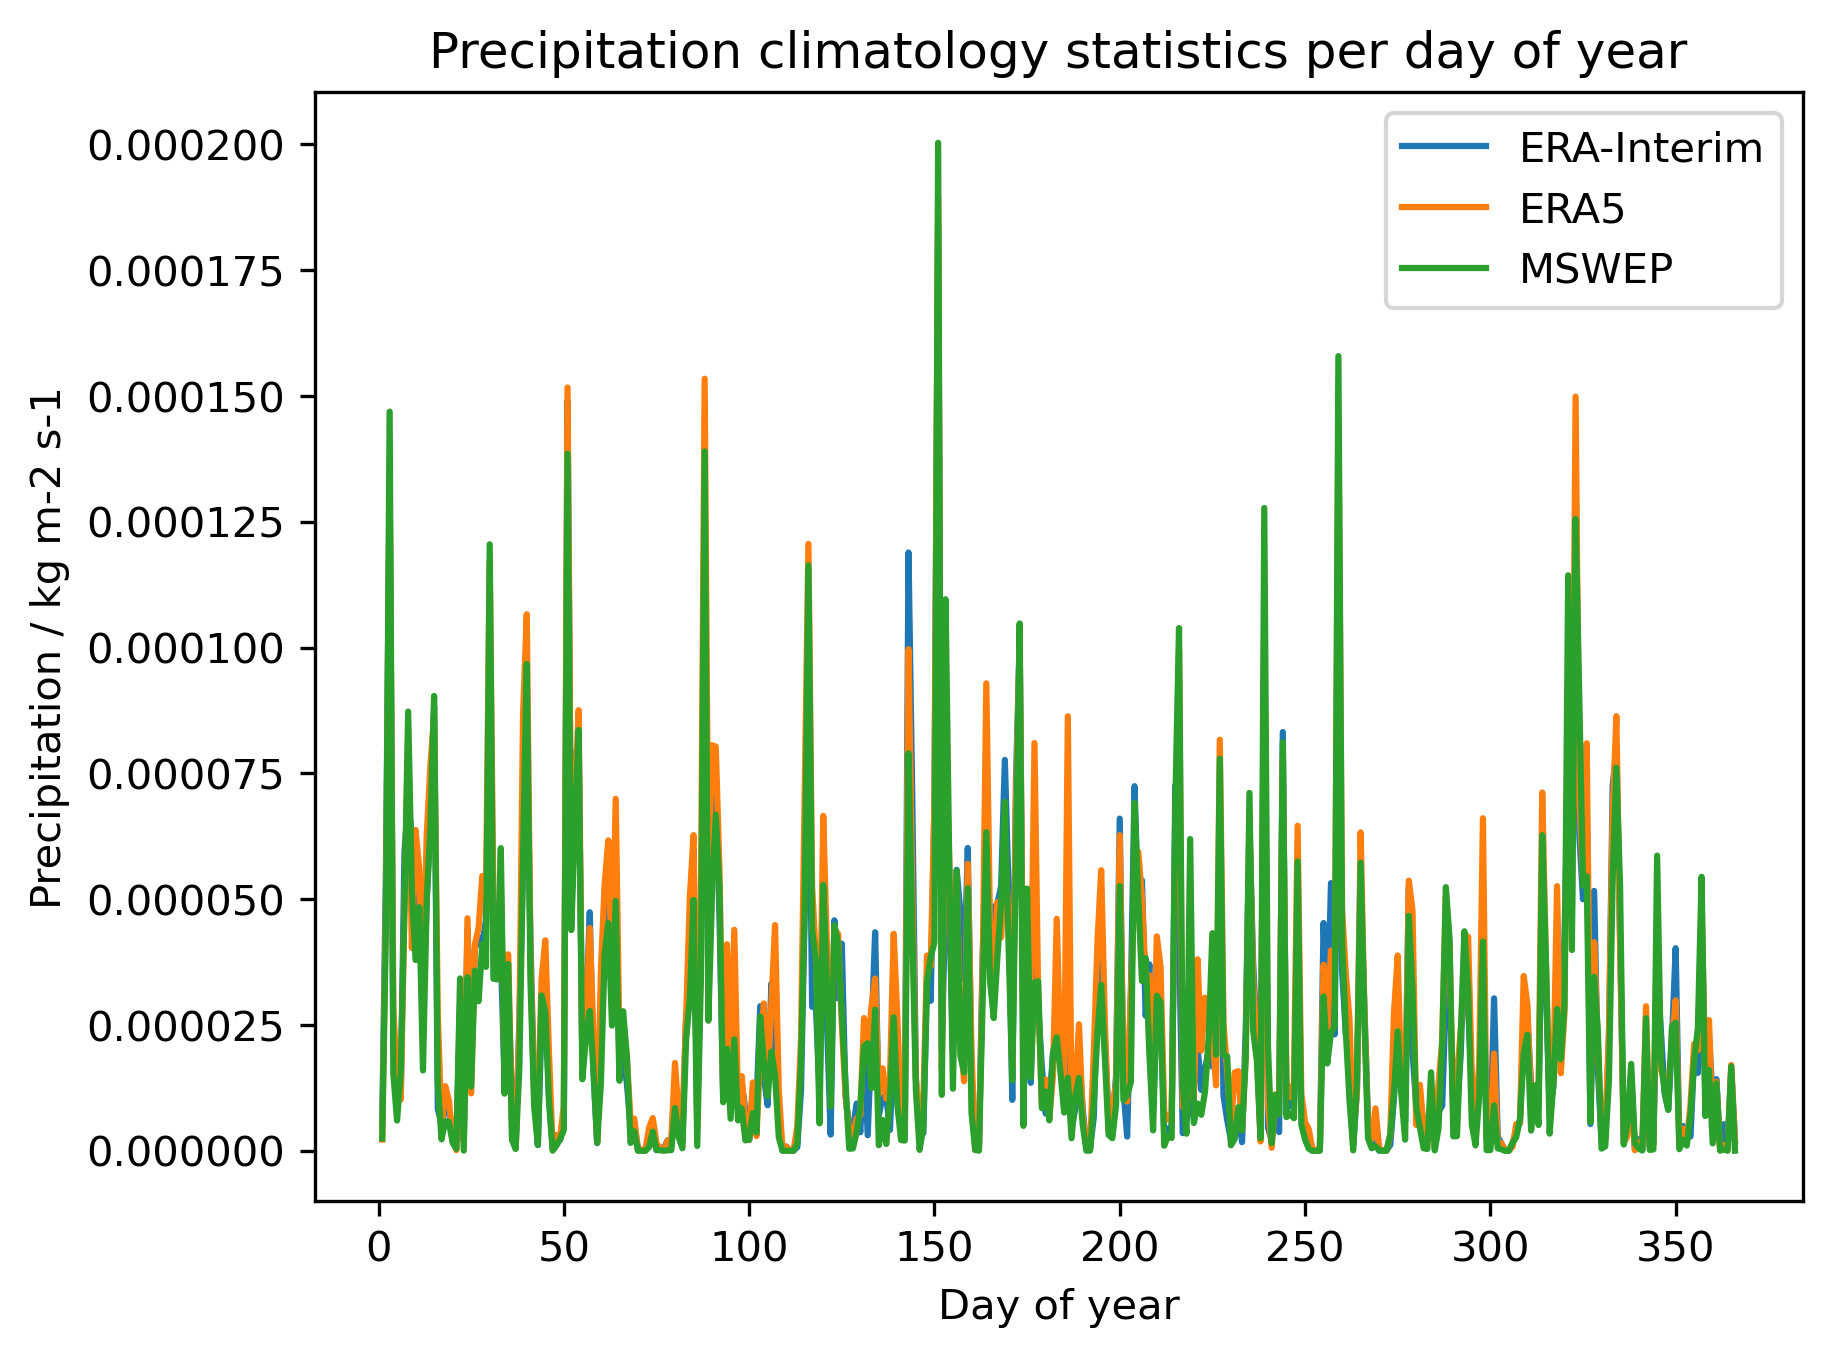
This recipe can be used to assess the agreement between forcing datasets (i.e. MSWEP, ERA5, ERA-Interim) for a defined catchment. The recipe can be used to:
Plot a timeseries of the raw daily data
Plot monthly aggregrated data over a defined period
Plot the monthly / daily climatology statistics over a defined period
Available recipes and diagnostics
Recipes are stored in esmvaltool/recipes/hydrology
recipe_hydro_forcing.yml
Diagnostics are stored in esmvaltool/diag_scripts/hydrology/
hydro_forcing.py: Compares and plots precipitation for MSWEP / ERA5 / ERA-5 interim datasets
User settings in recipe
All hydrological recipes require a shapefile as an input to select forcing data. This shapefile determines the shape of the basin for which the data will be cut out and processed. All recipes are tested with the shapefiles from HydroSHEDS that are used for the eWaterCycle project. In principle any shapefile can be used, for example, the freely available basin shapefiles from the HydroSHEDS project.
recipe
hydrology/hydro_forcing.yml
Optional preprocessor settings:
extract_shape: The region specified here should match the catchmentRequired settings for script:
plot_type: Define which plot function to run. Choices:
timeseries: Plot a timeseries for the variable data over the defined period
climatology: Plot the climate statistics over the defined periodRequired settings for ``timeseries`` plots:
time_period: Defines the period of the output for the correct captions/labels. This value should match the period used for the preprocessor. Choices:day,month.
Variables
pr (atmos, daily or monthly, longitude, latitude, time)