Gallery
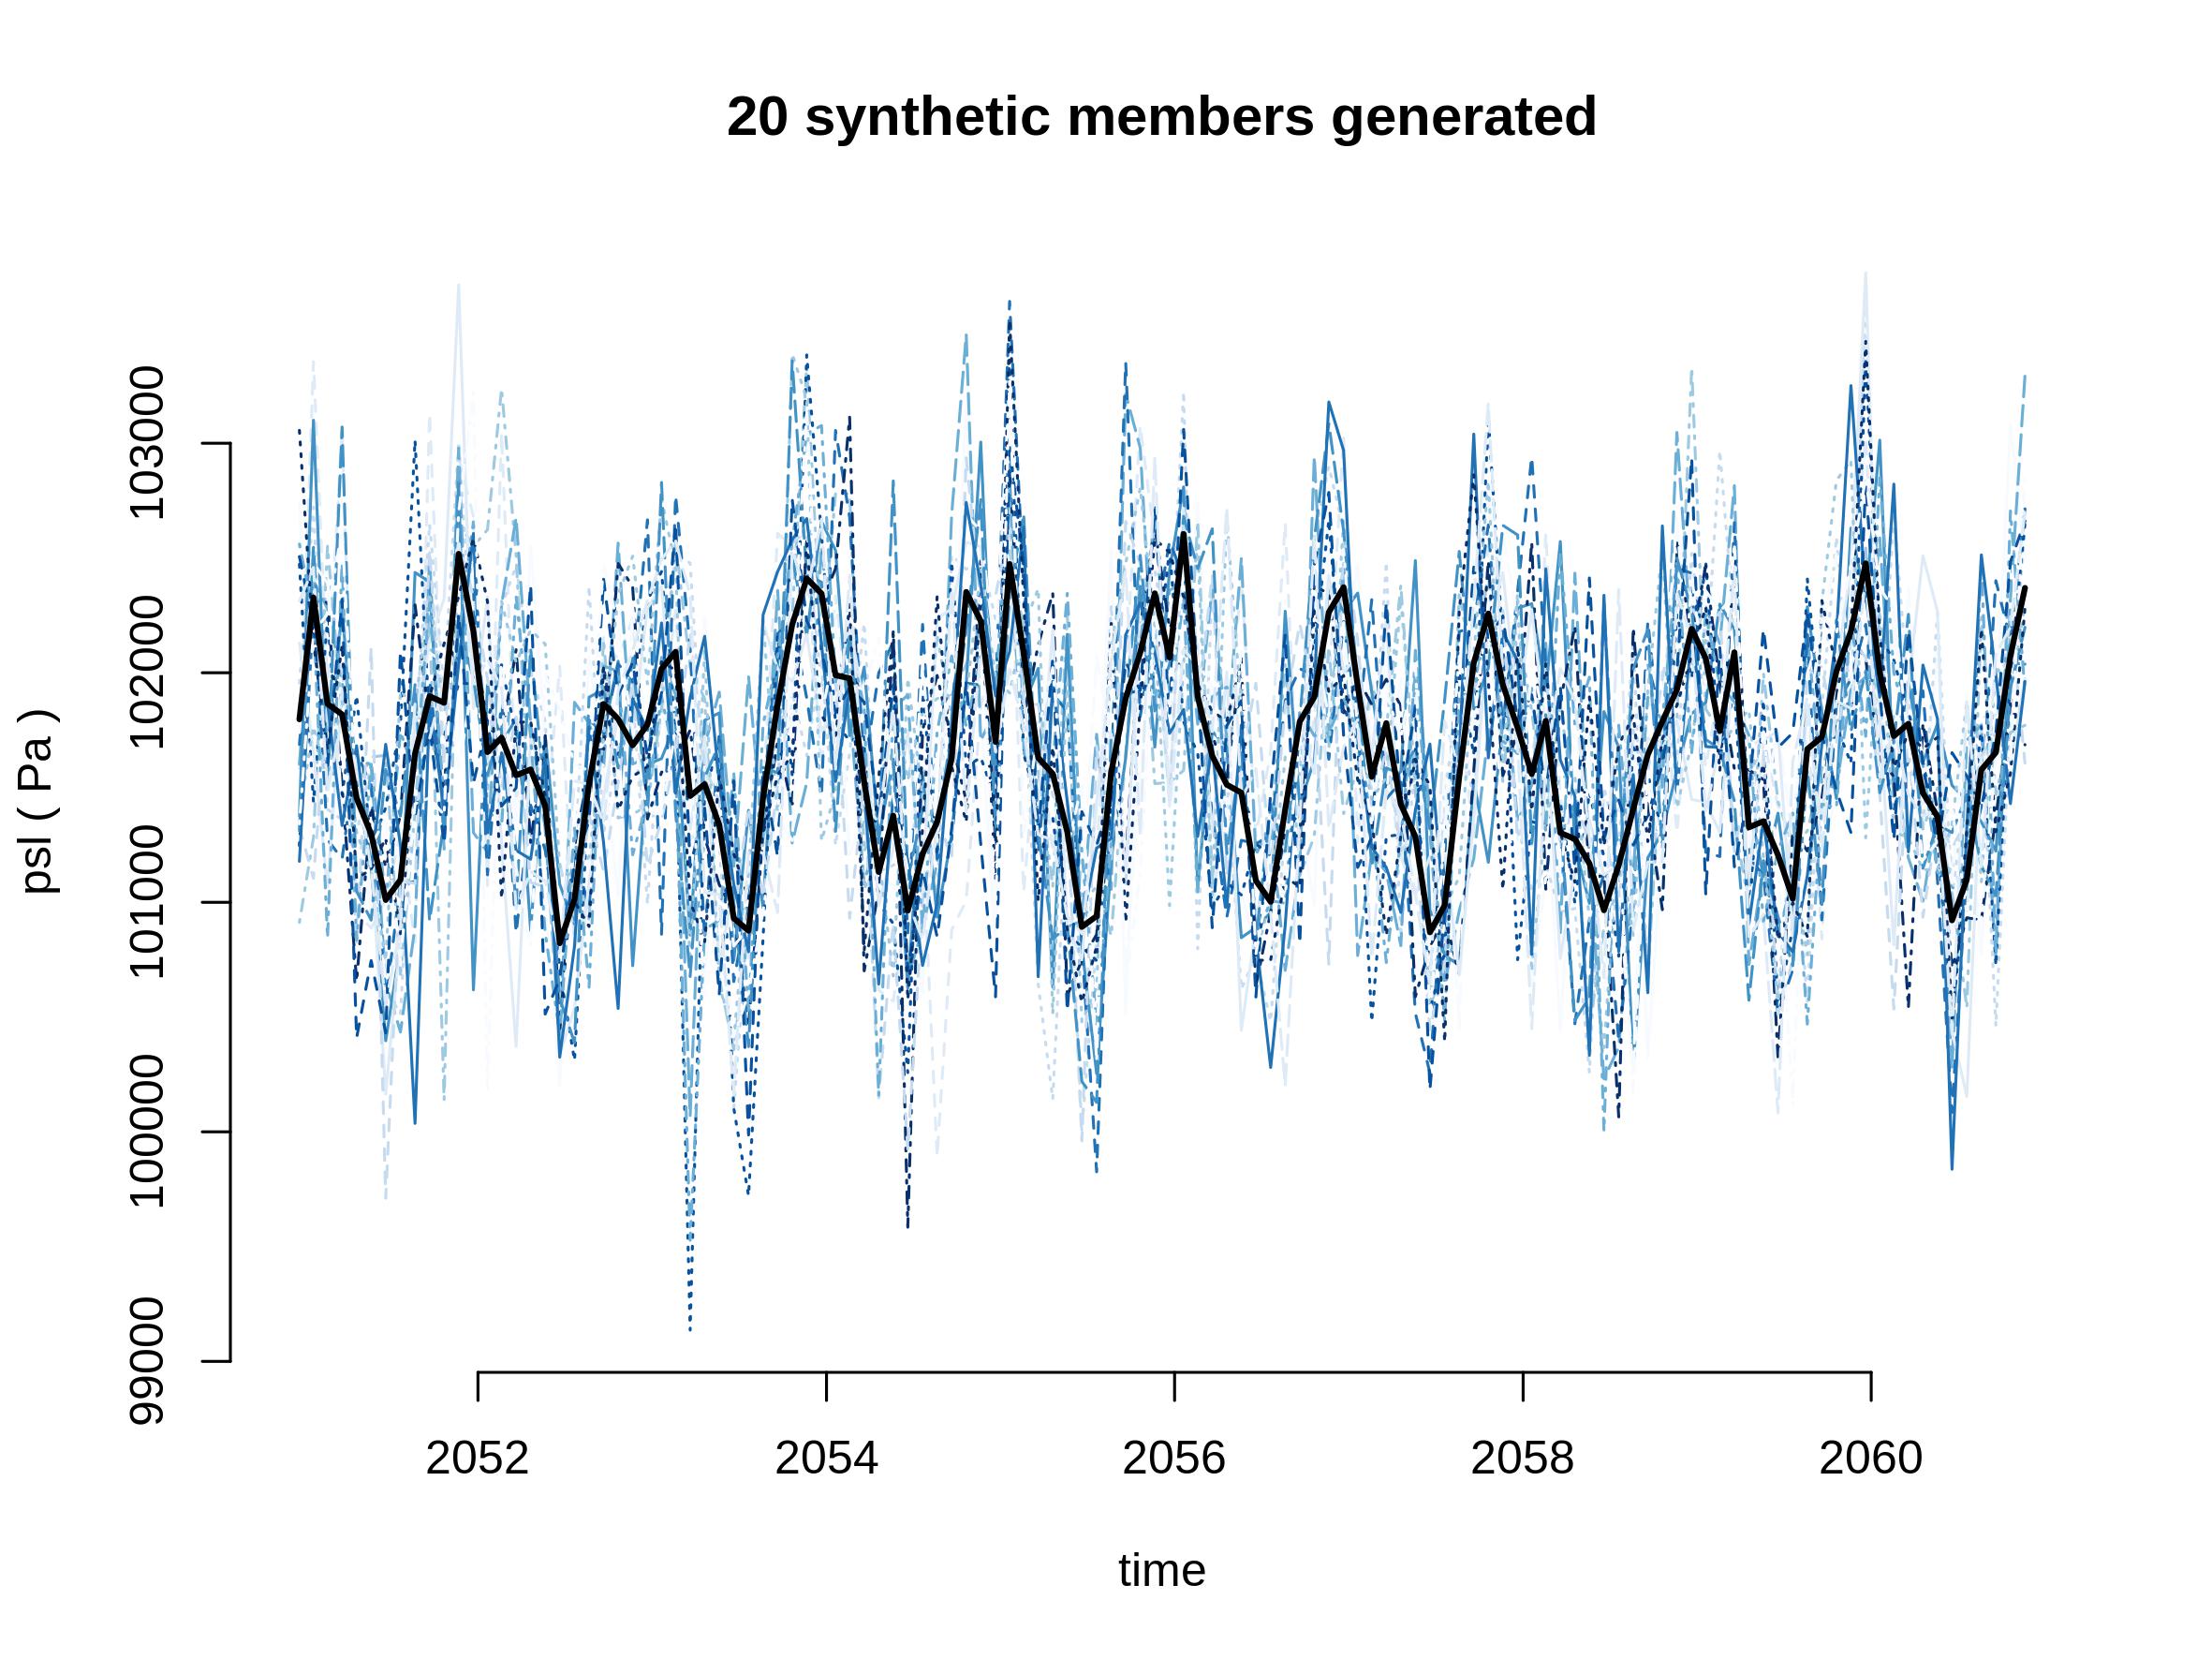
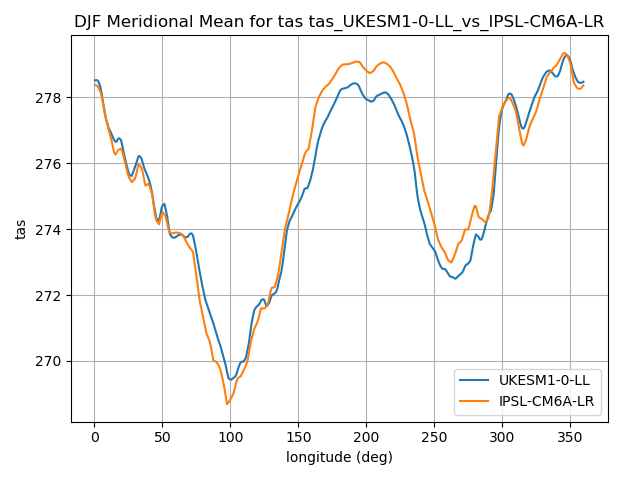
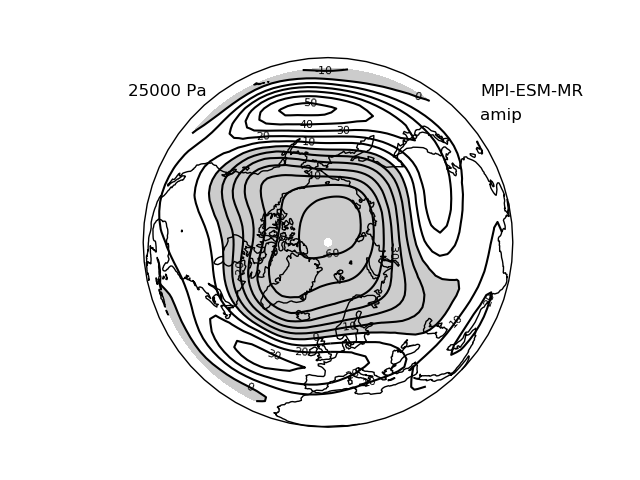
This section shows example plots produced by ESMValTool. For more information, click on the footnote below the image.
- 1
- 2
- 3
- 4
- 5
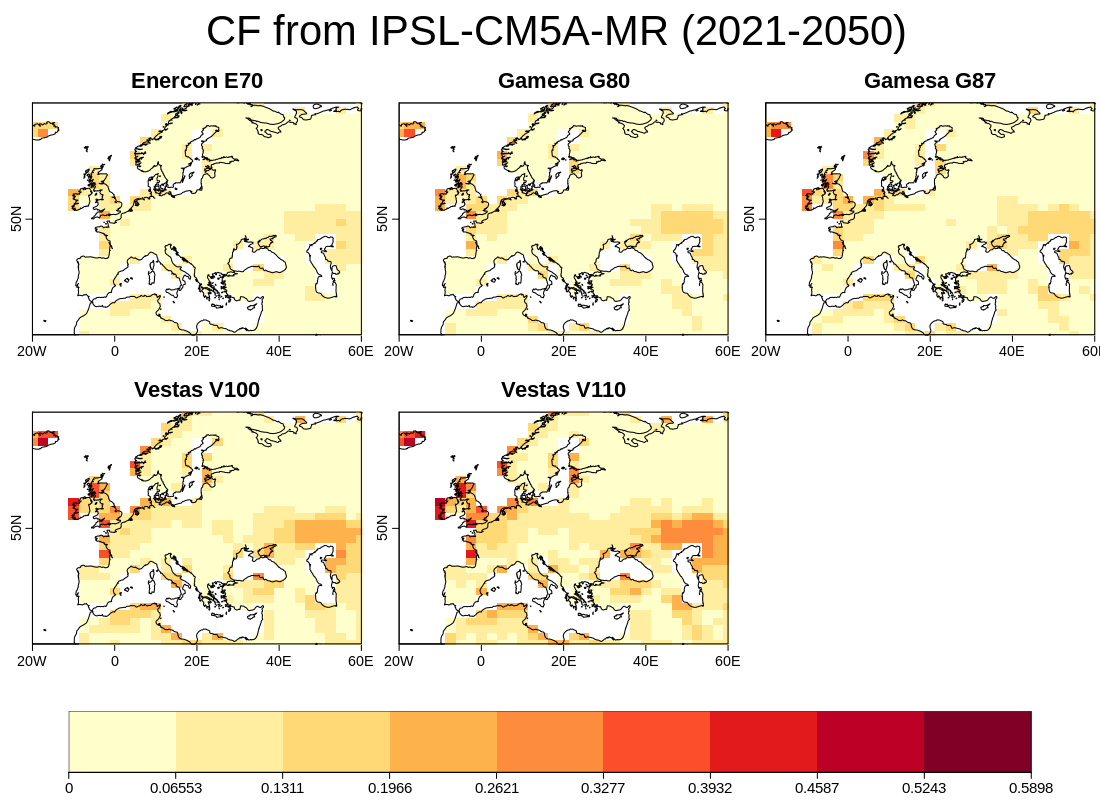
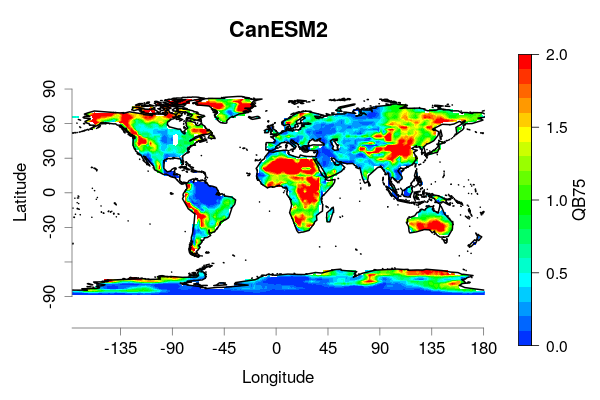
Capacity factor of wind power: Ratio of average estimated power to theoretical maximum power
- 6
- 7
- 8
- 9
- 10
- 11
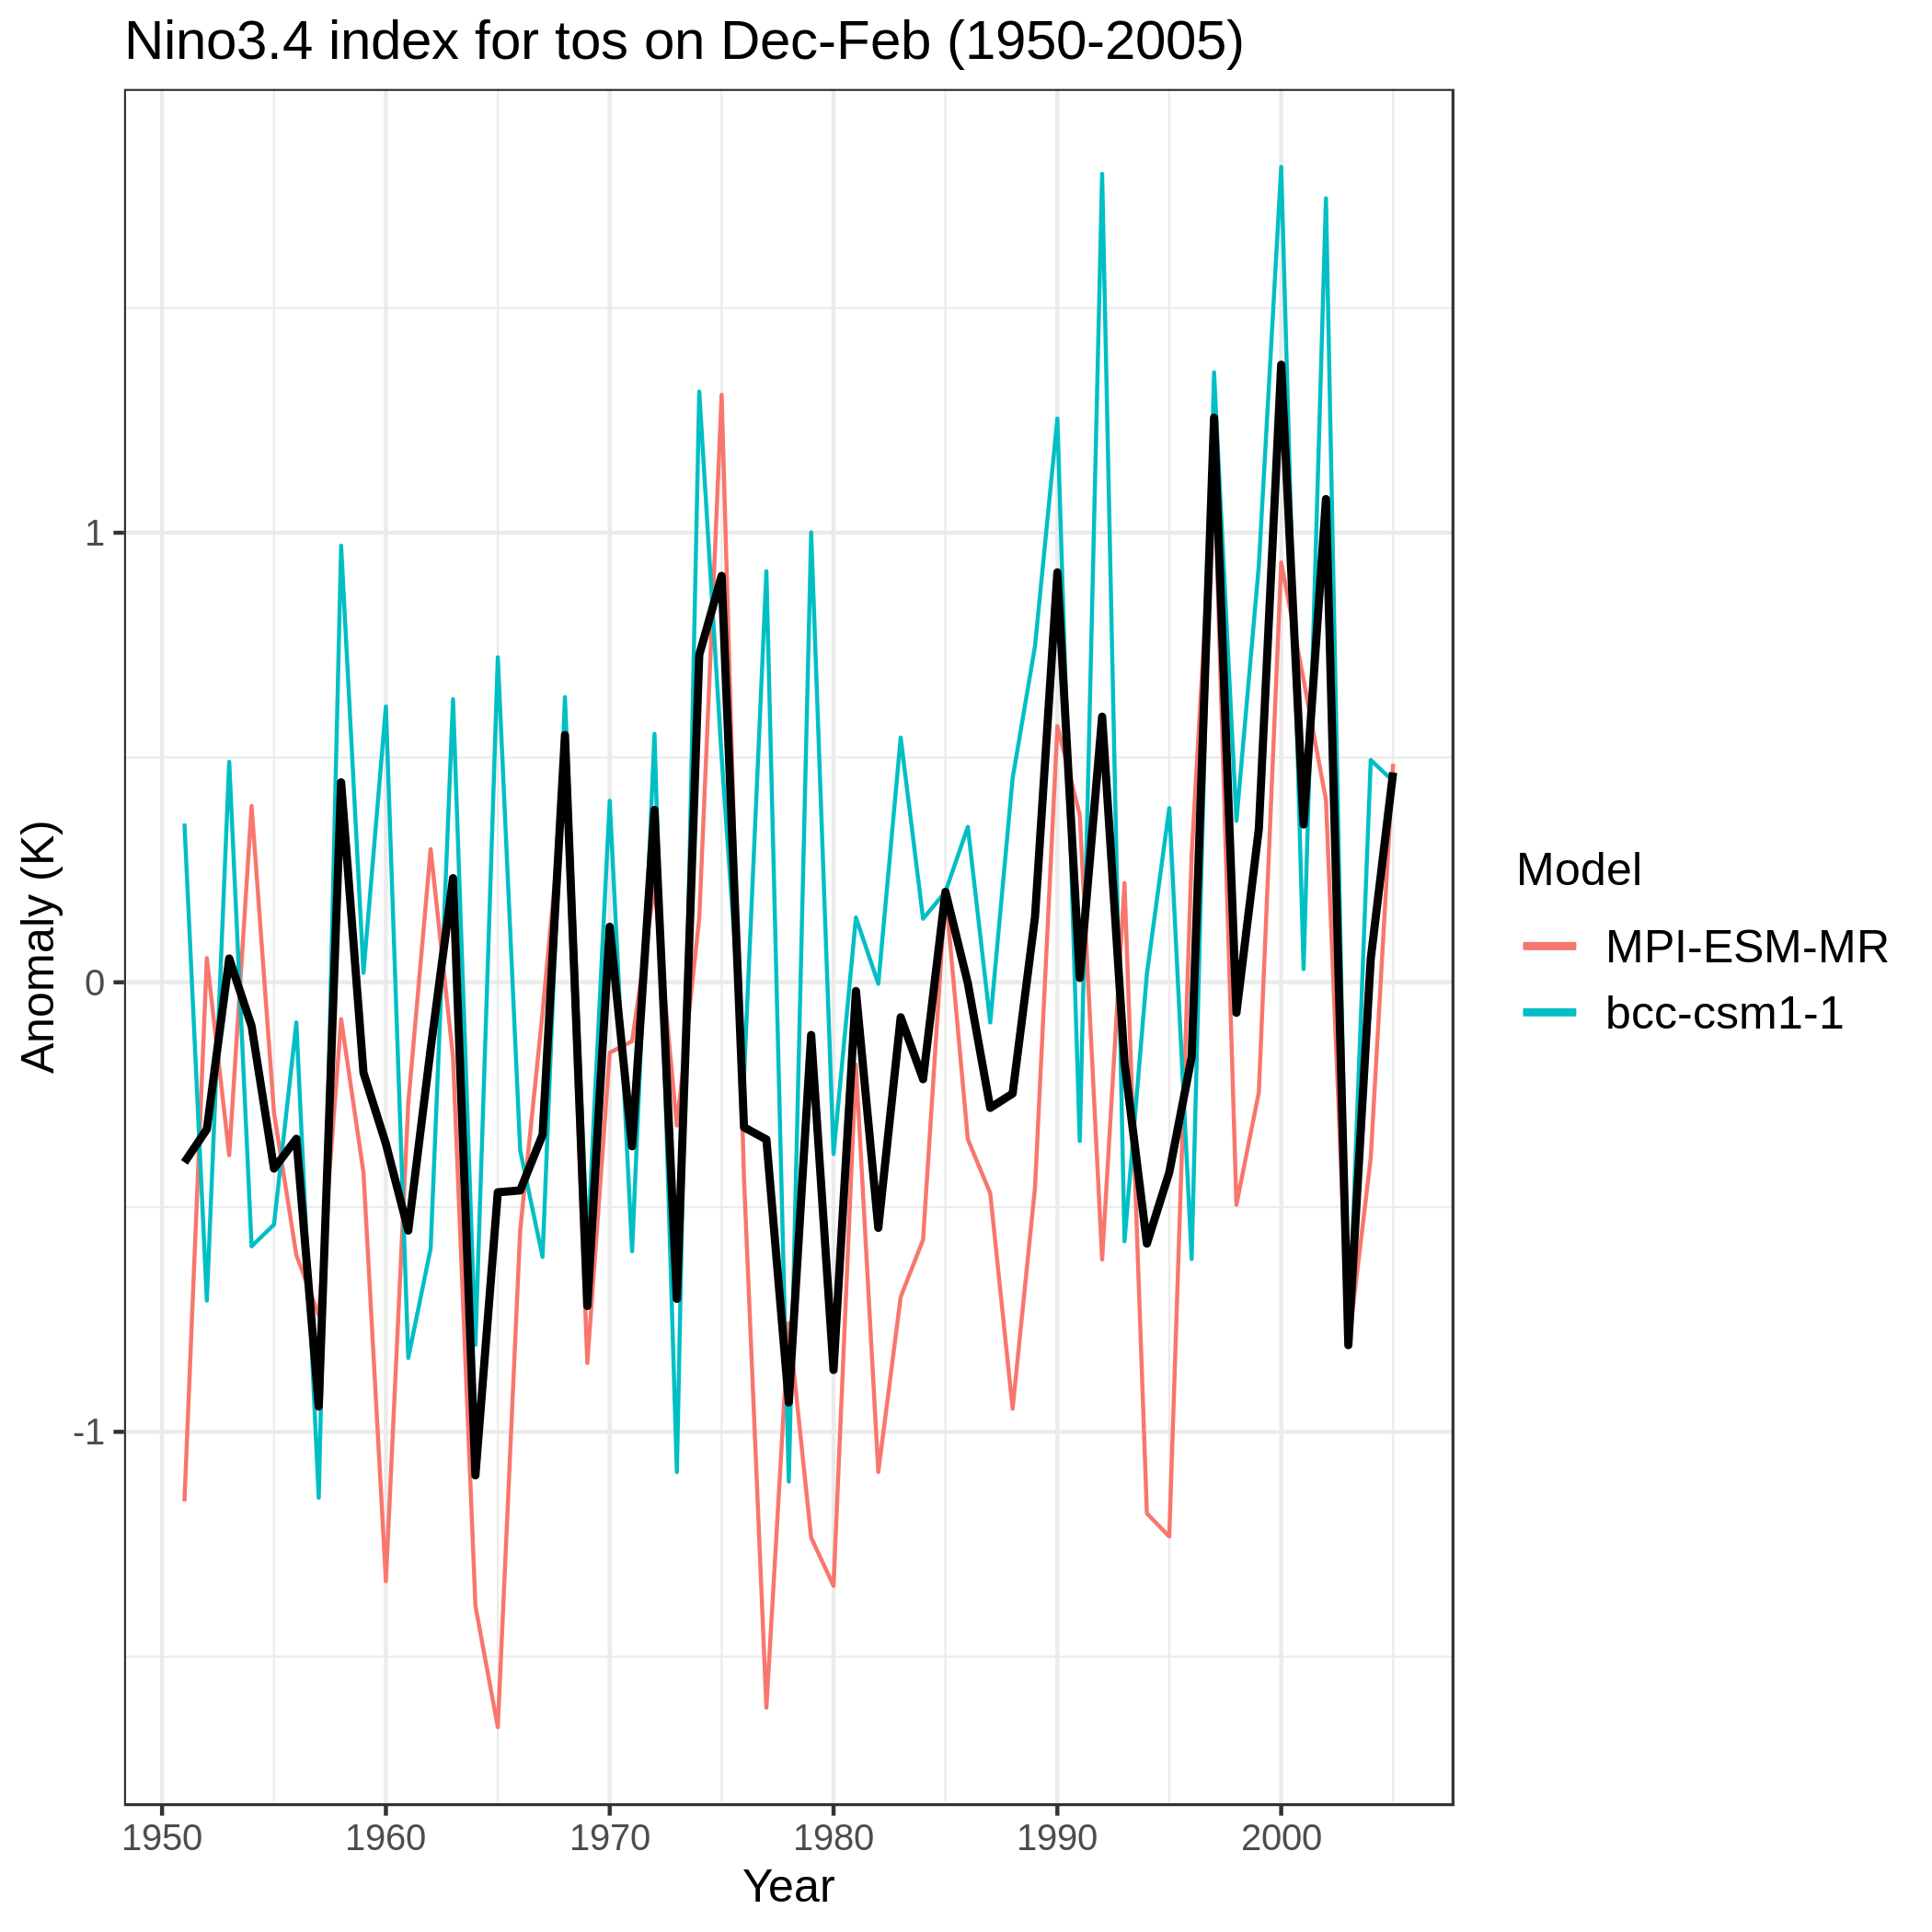
Nino indices, North Atlantic Oscillation (NAO), Souther Oscillation Index (SOI)
- 12
- 13
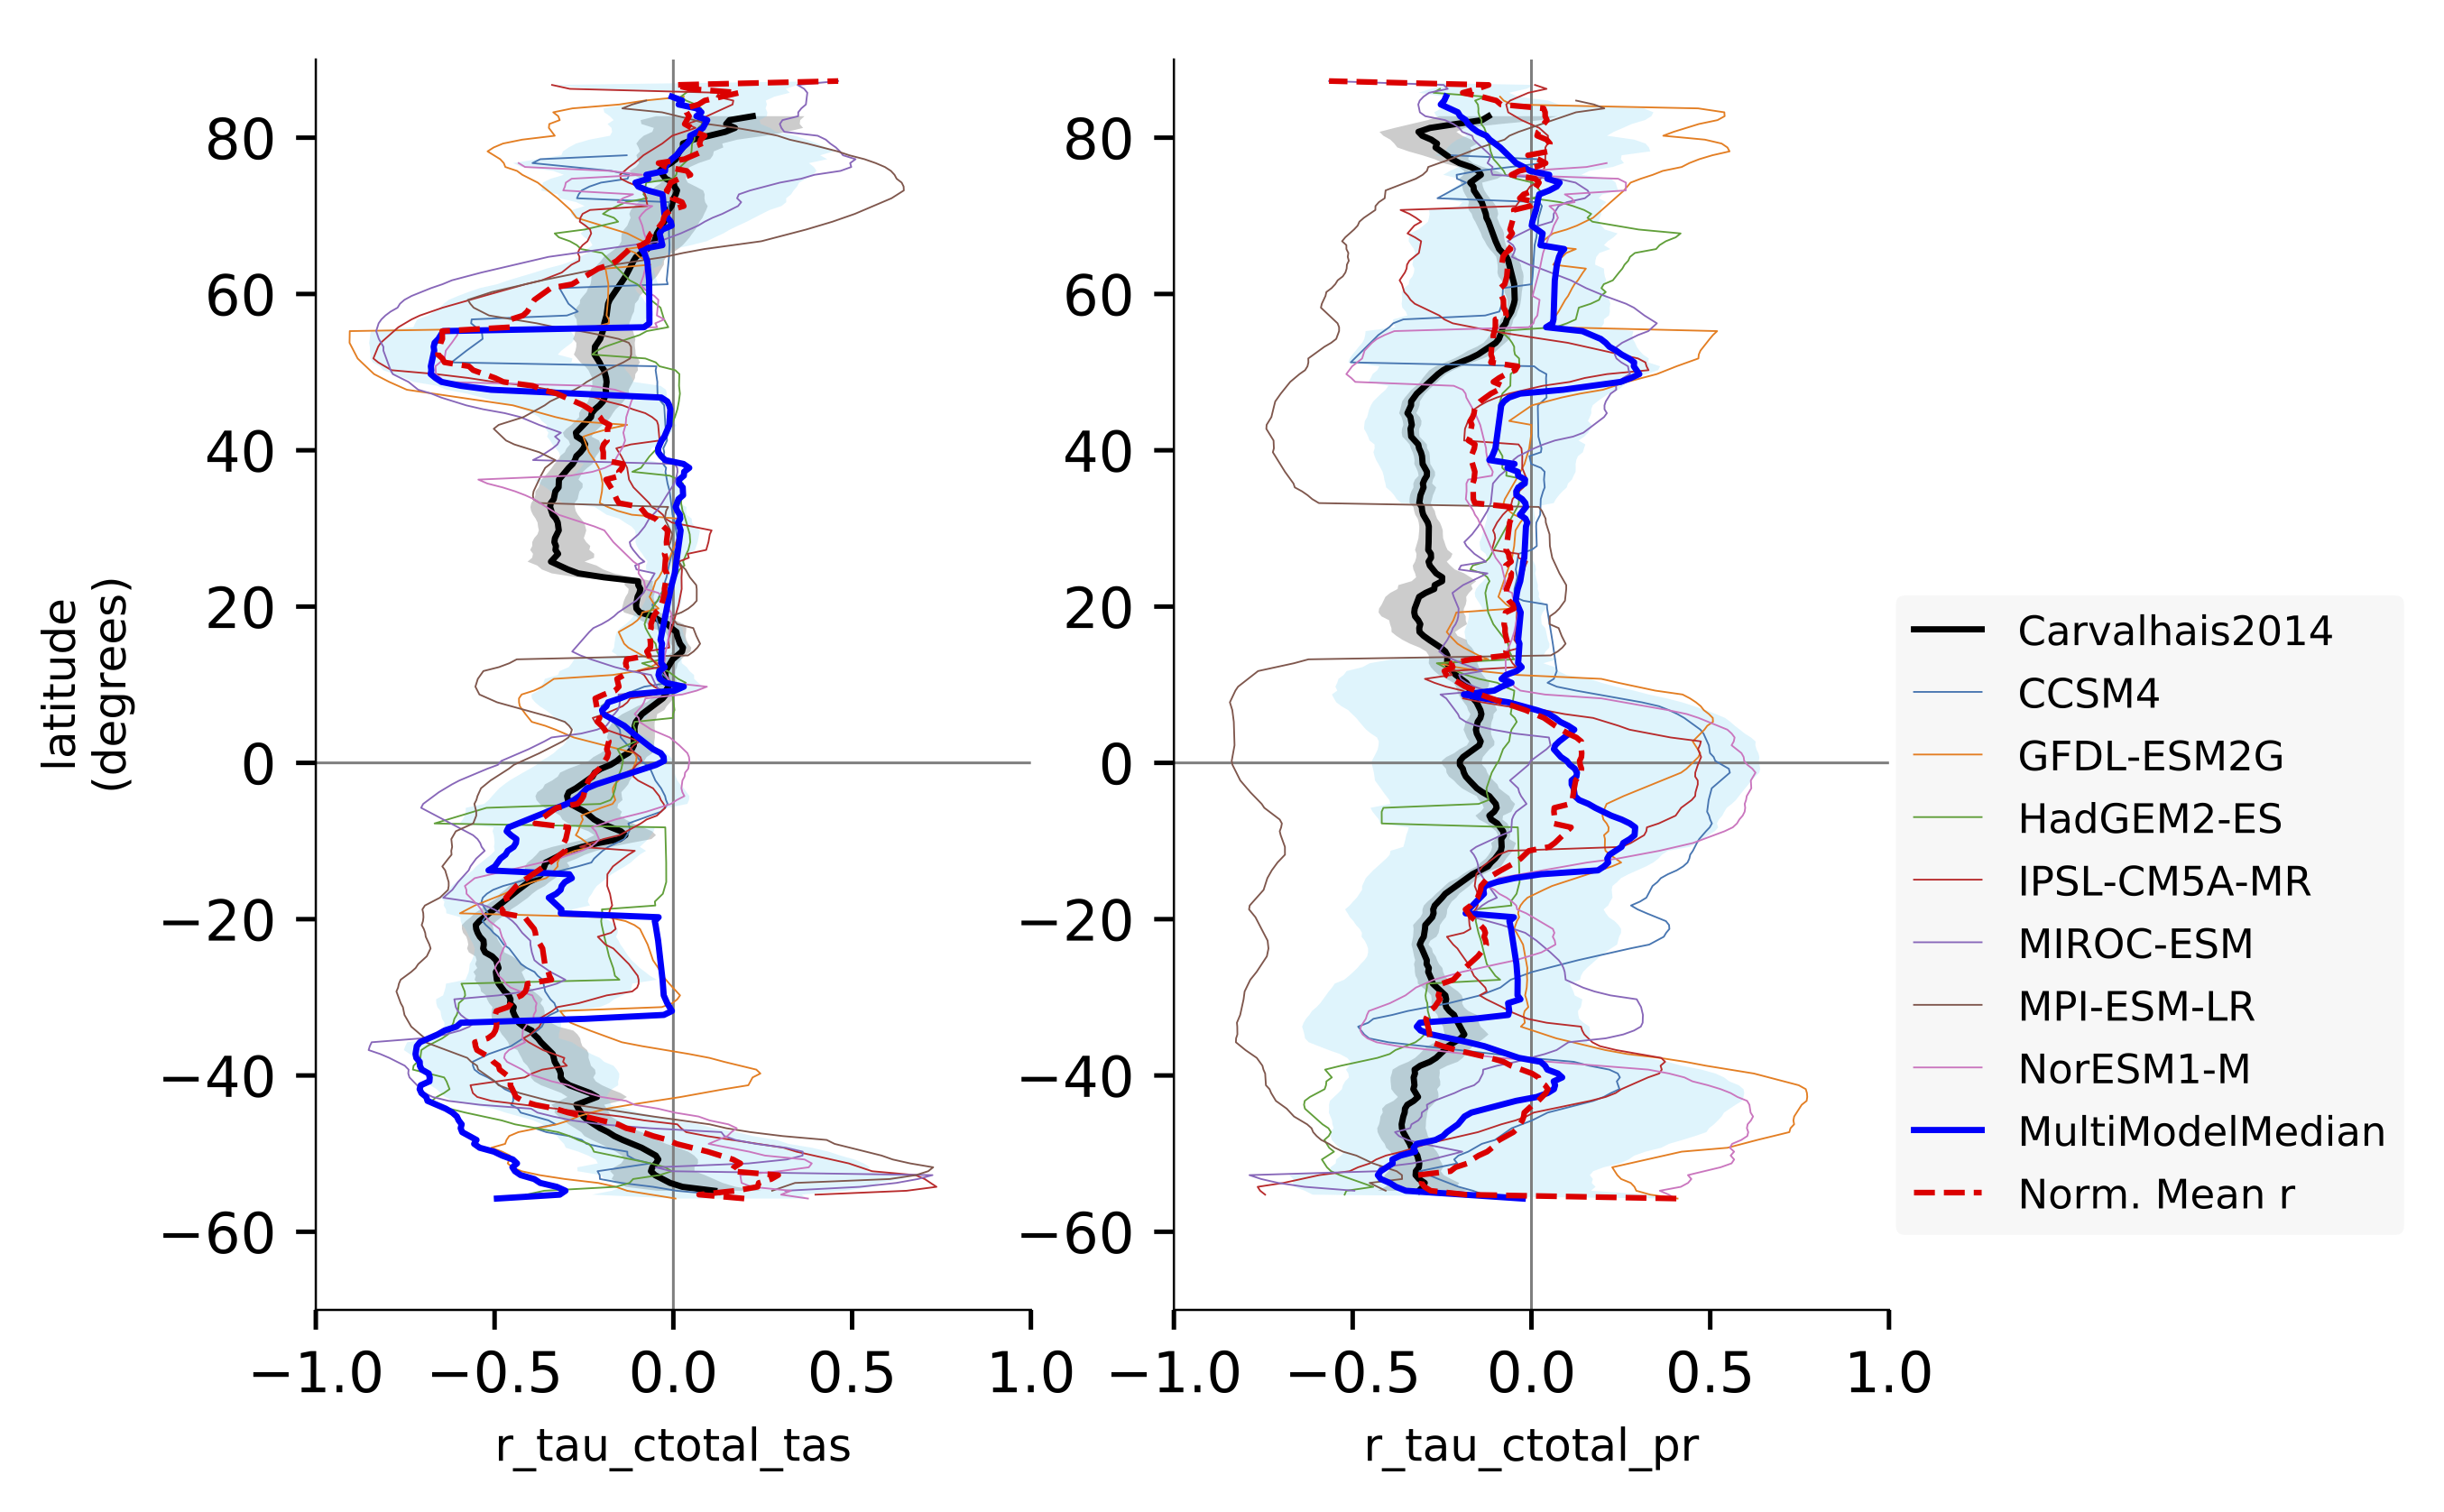
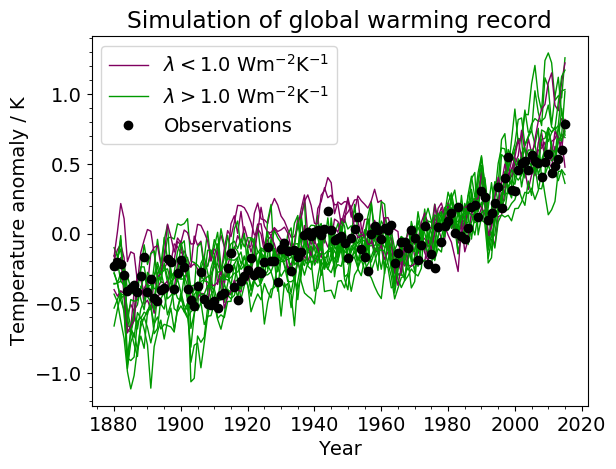
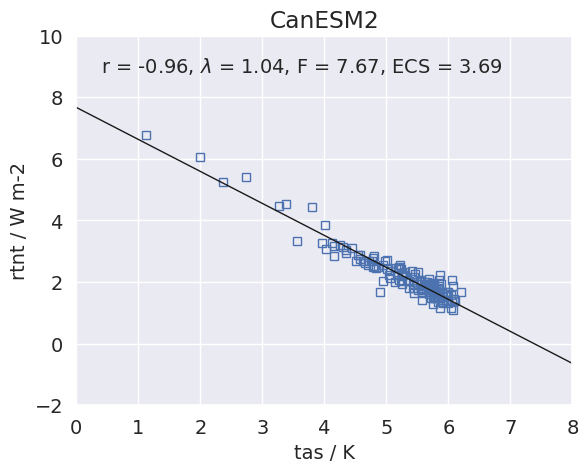
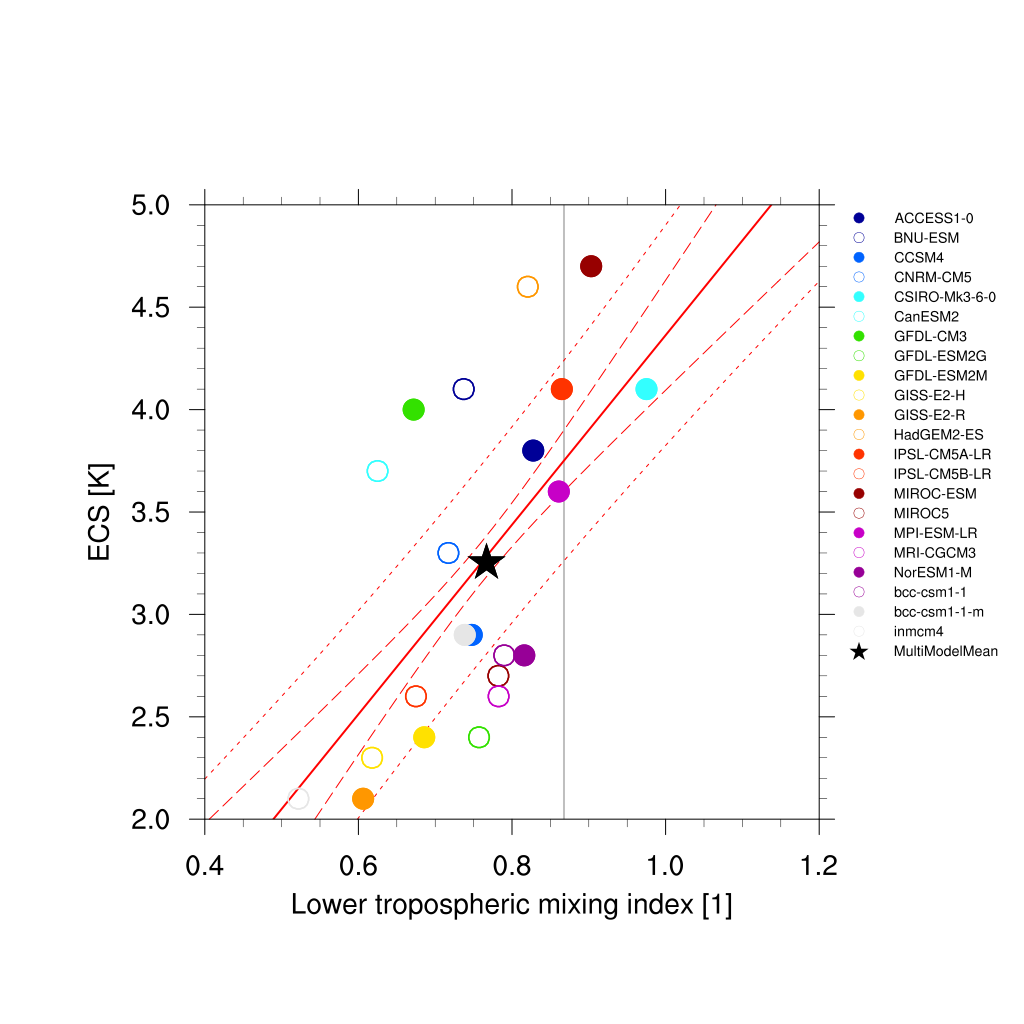
Emergent constraint on equilibrium climate sensitivity from global temperature variability
- 14
- 15
- 16
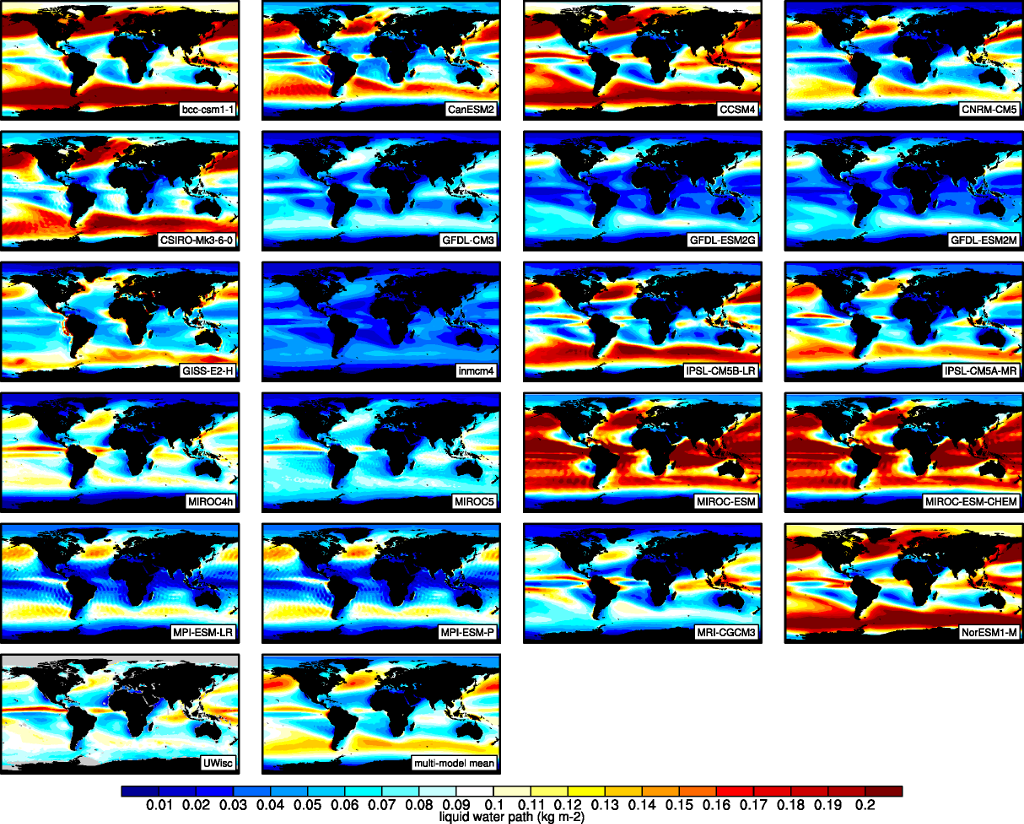
Evaluate water vapor short wave radiance absorption schemes of ESMs with the observations.
- 17
- 18
- 19
- 20
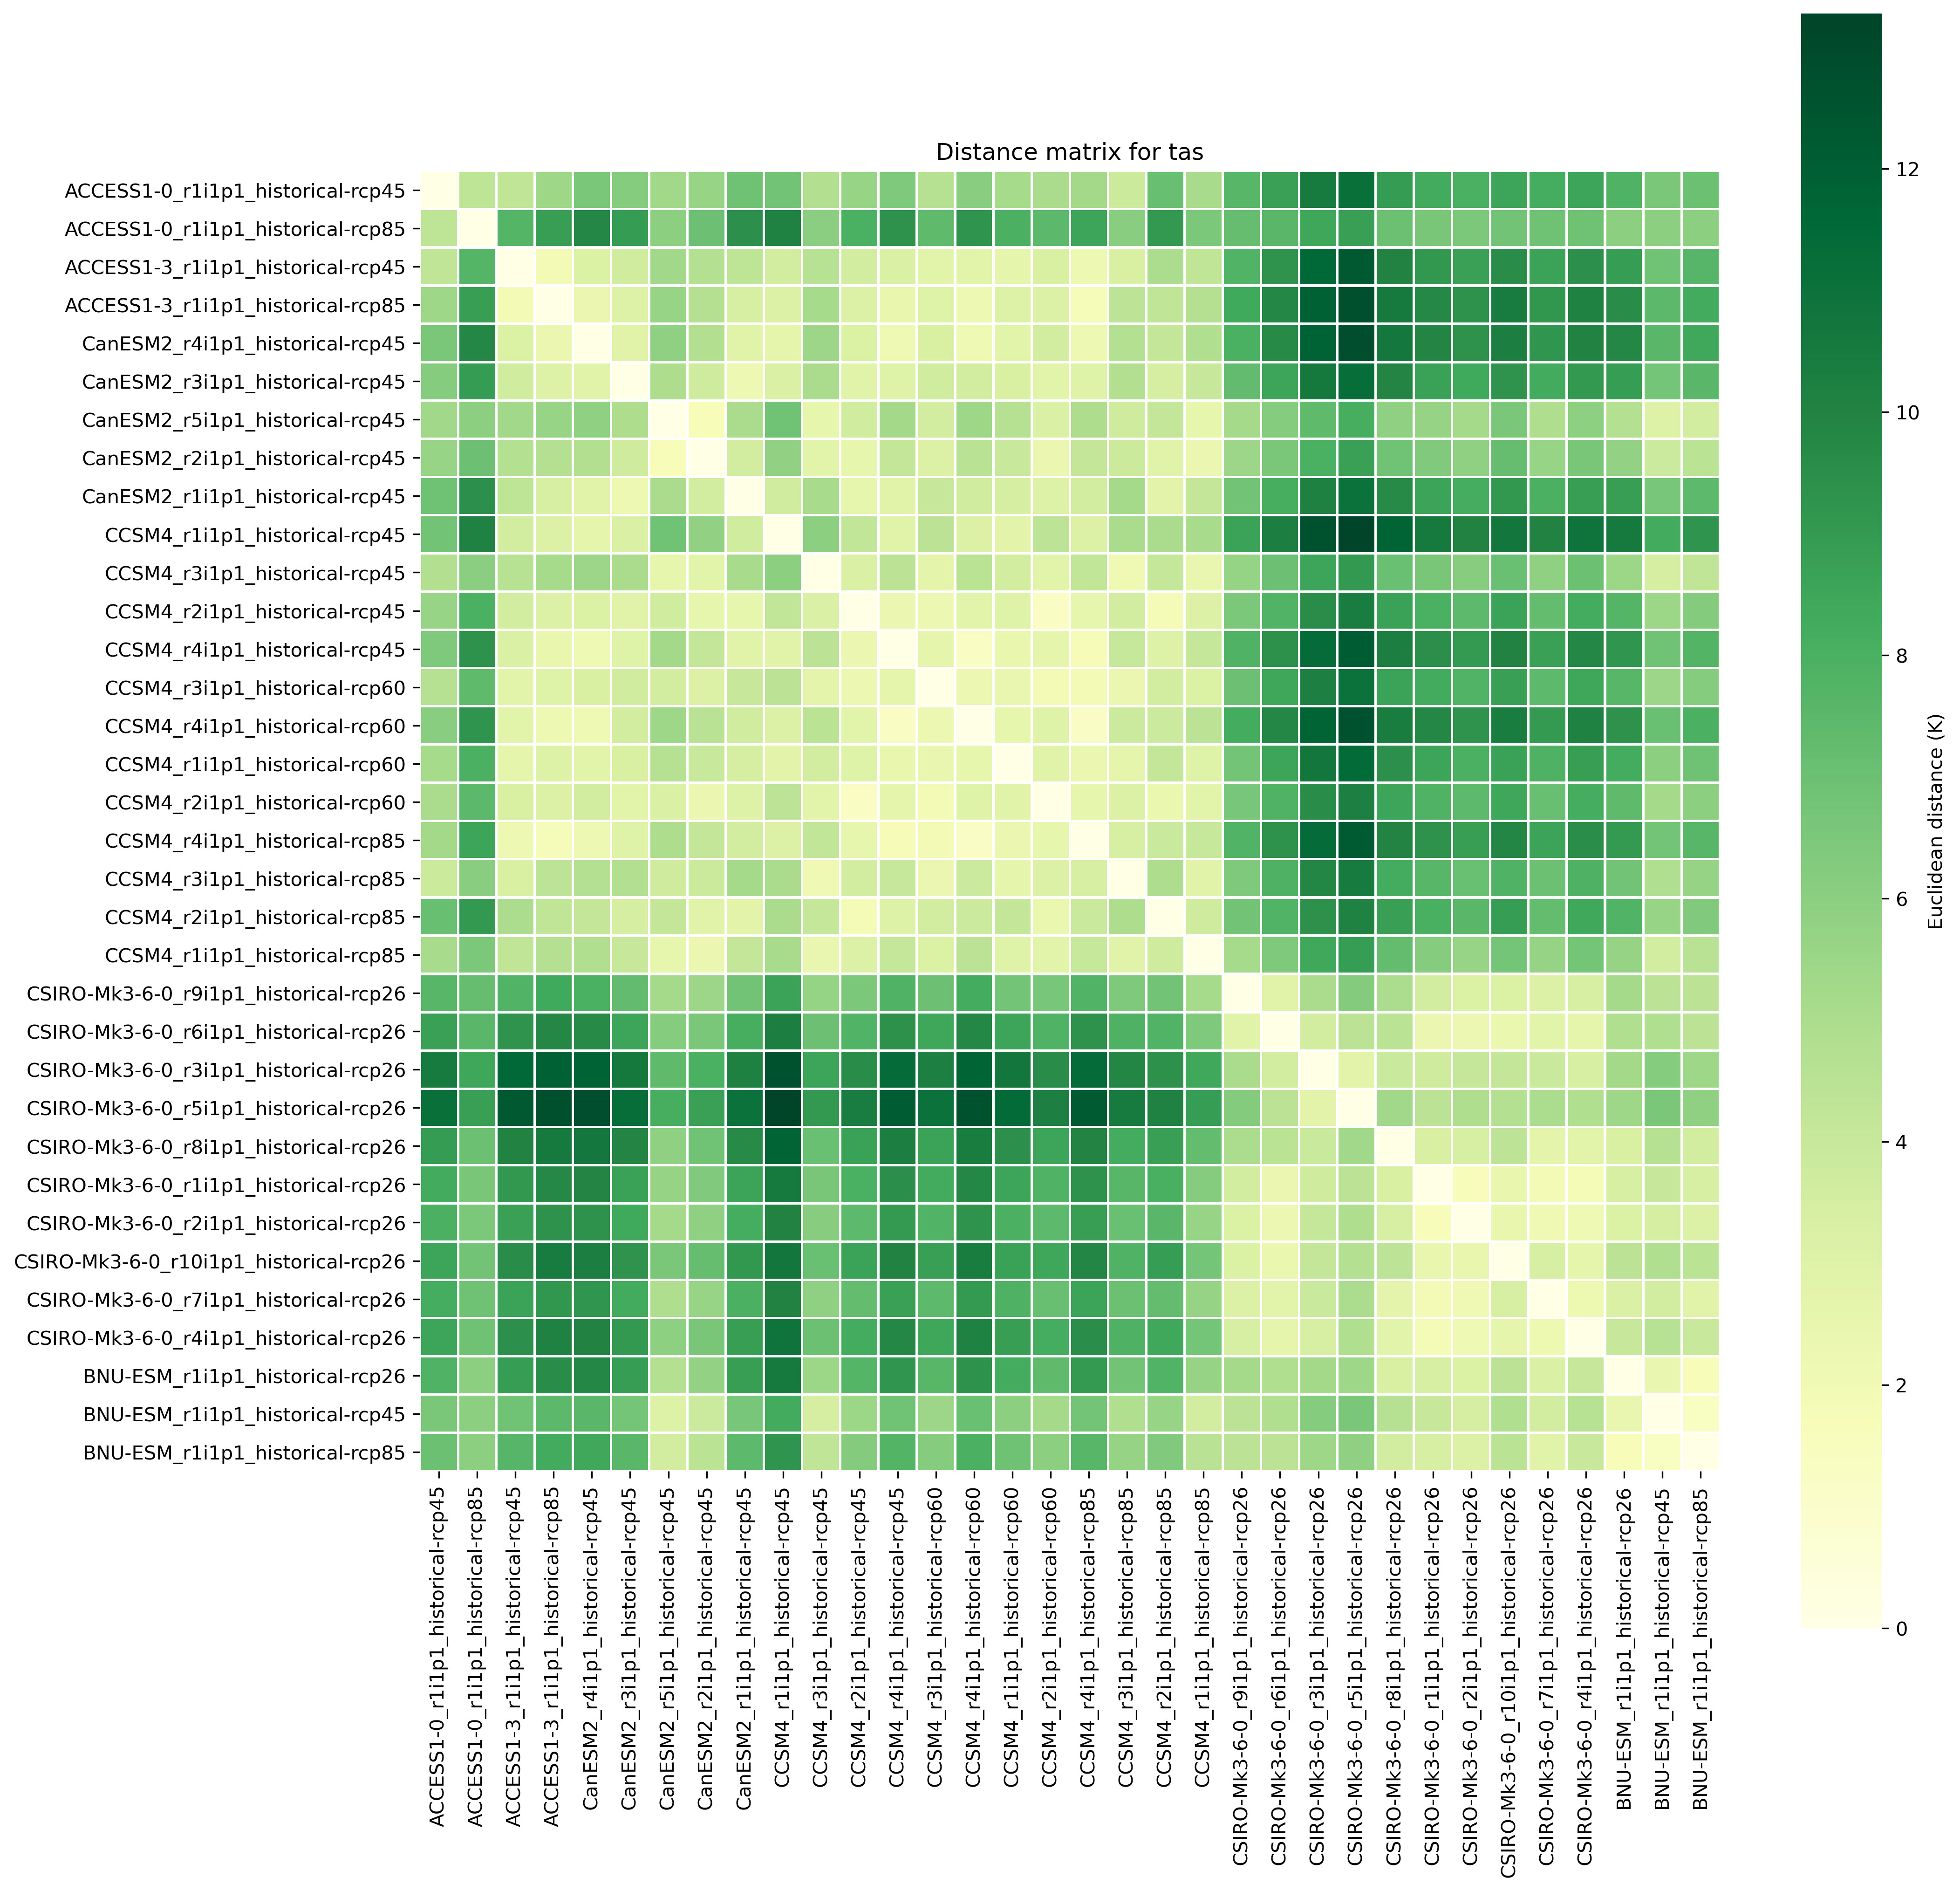
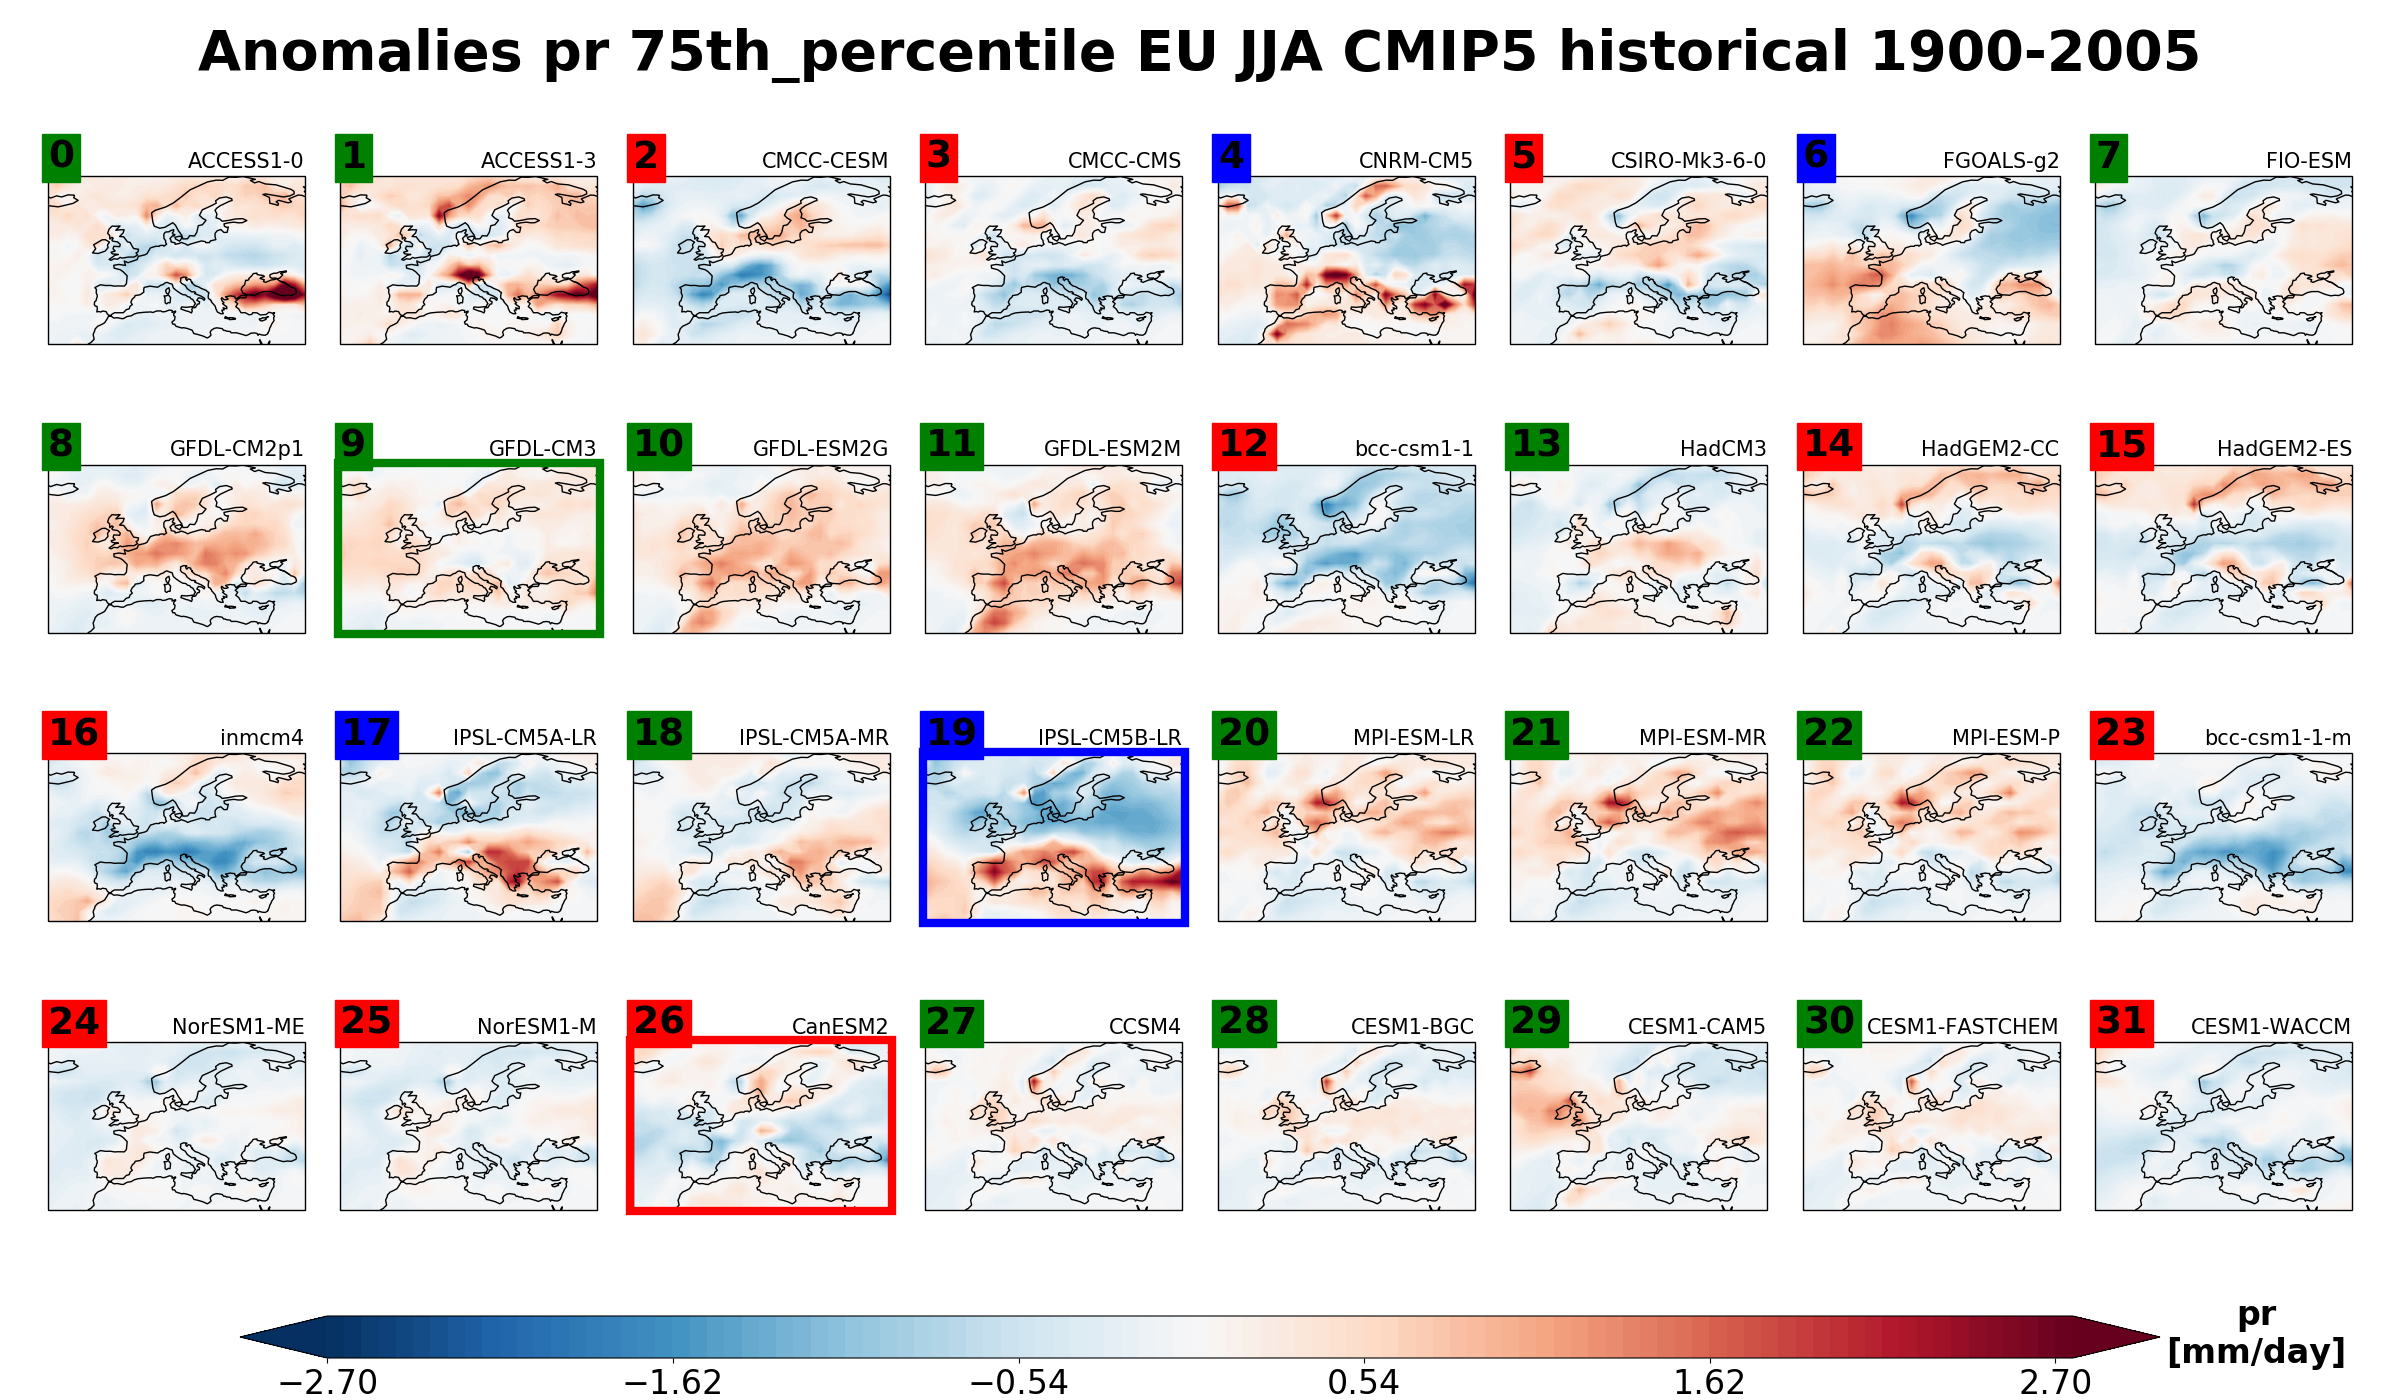
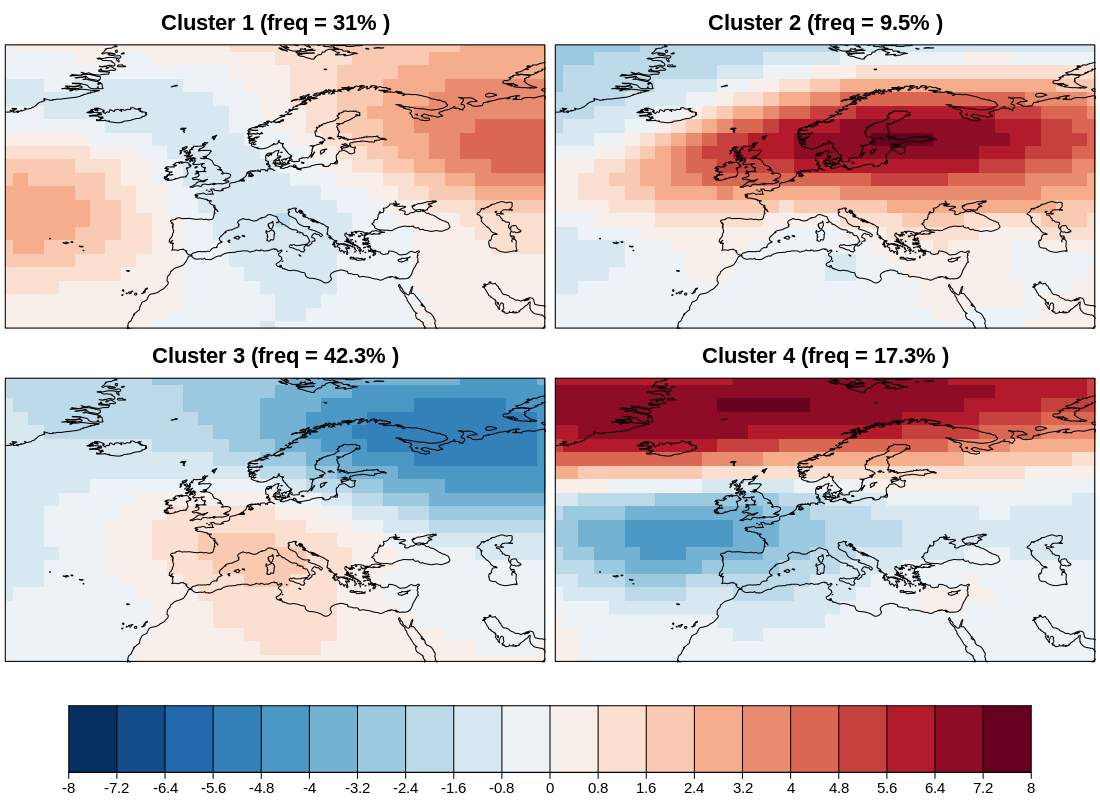
Ensemble Clustering - a cluster analysis tool for climate model simulations (EnsClus)
- 21
- 22
- 23
- 24
- 25
- 26
- 27
- 28
- 29
- 30
- 31
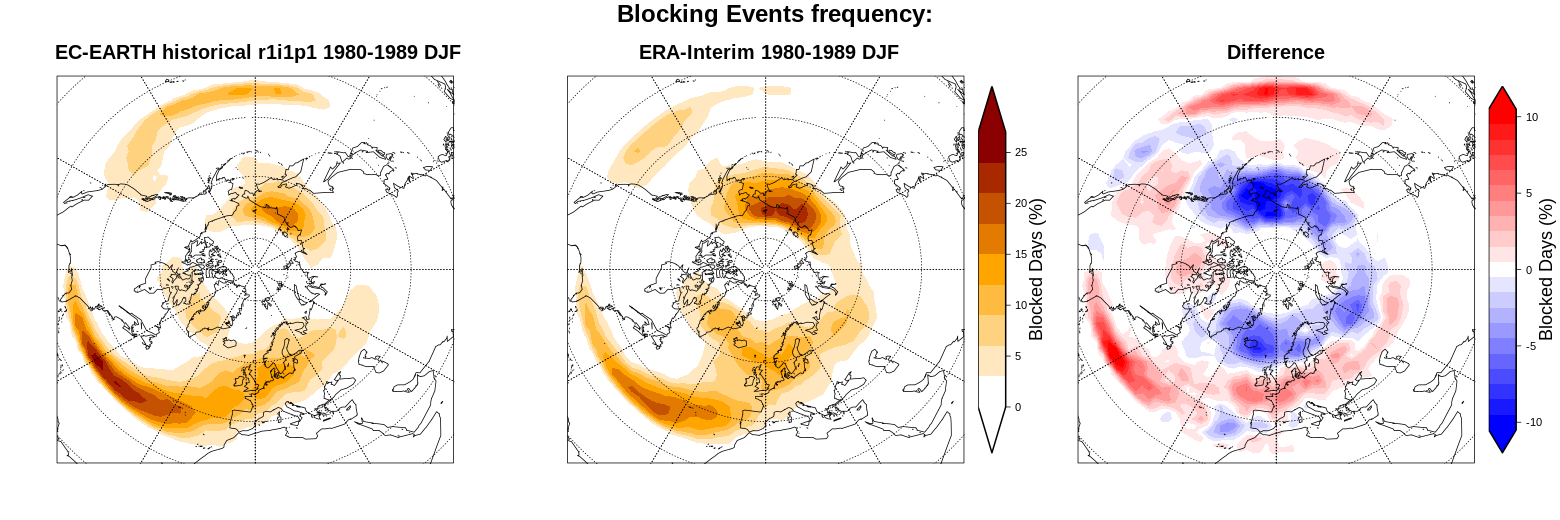
Blocking metrics and indices, teleconnections and weather regimes (MiLES)
- 32
- 33
- 34
- 35
- 36
- 37
- 38
- 39
- 40
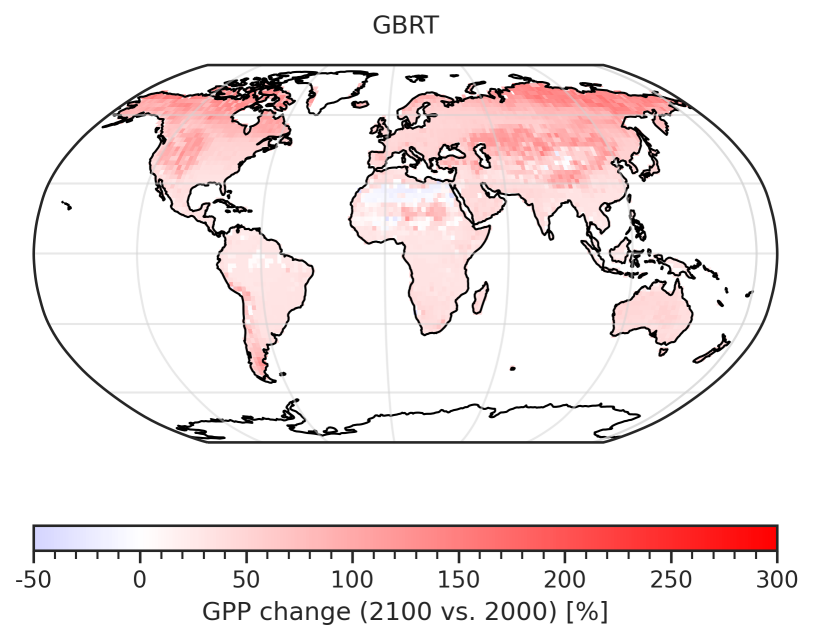
Constraining uncertainty in projected gross primary production (GPP) with machine learning
- 41
- 42
- 43
- 44
- 45
- 46
- 47
- 48
- 49
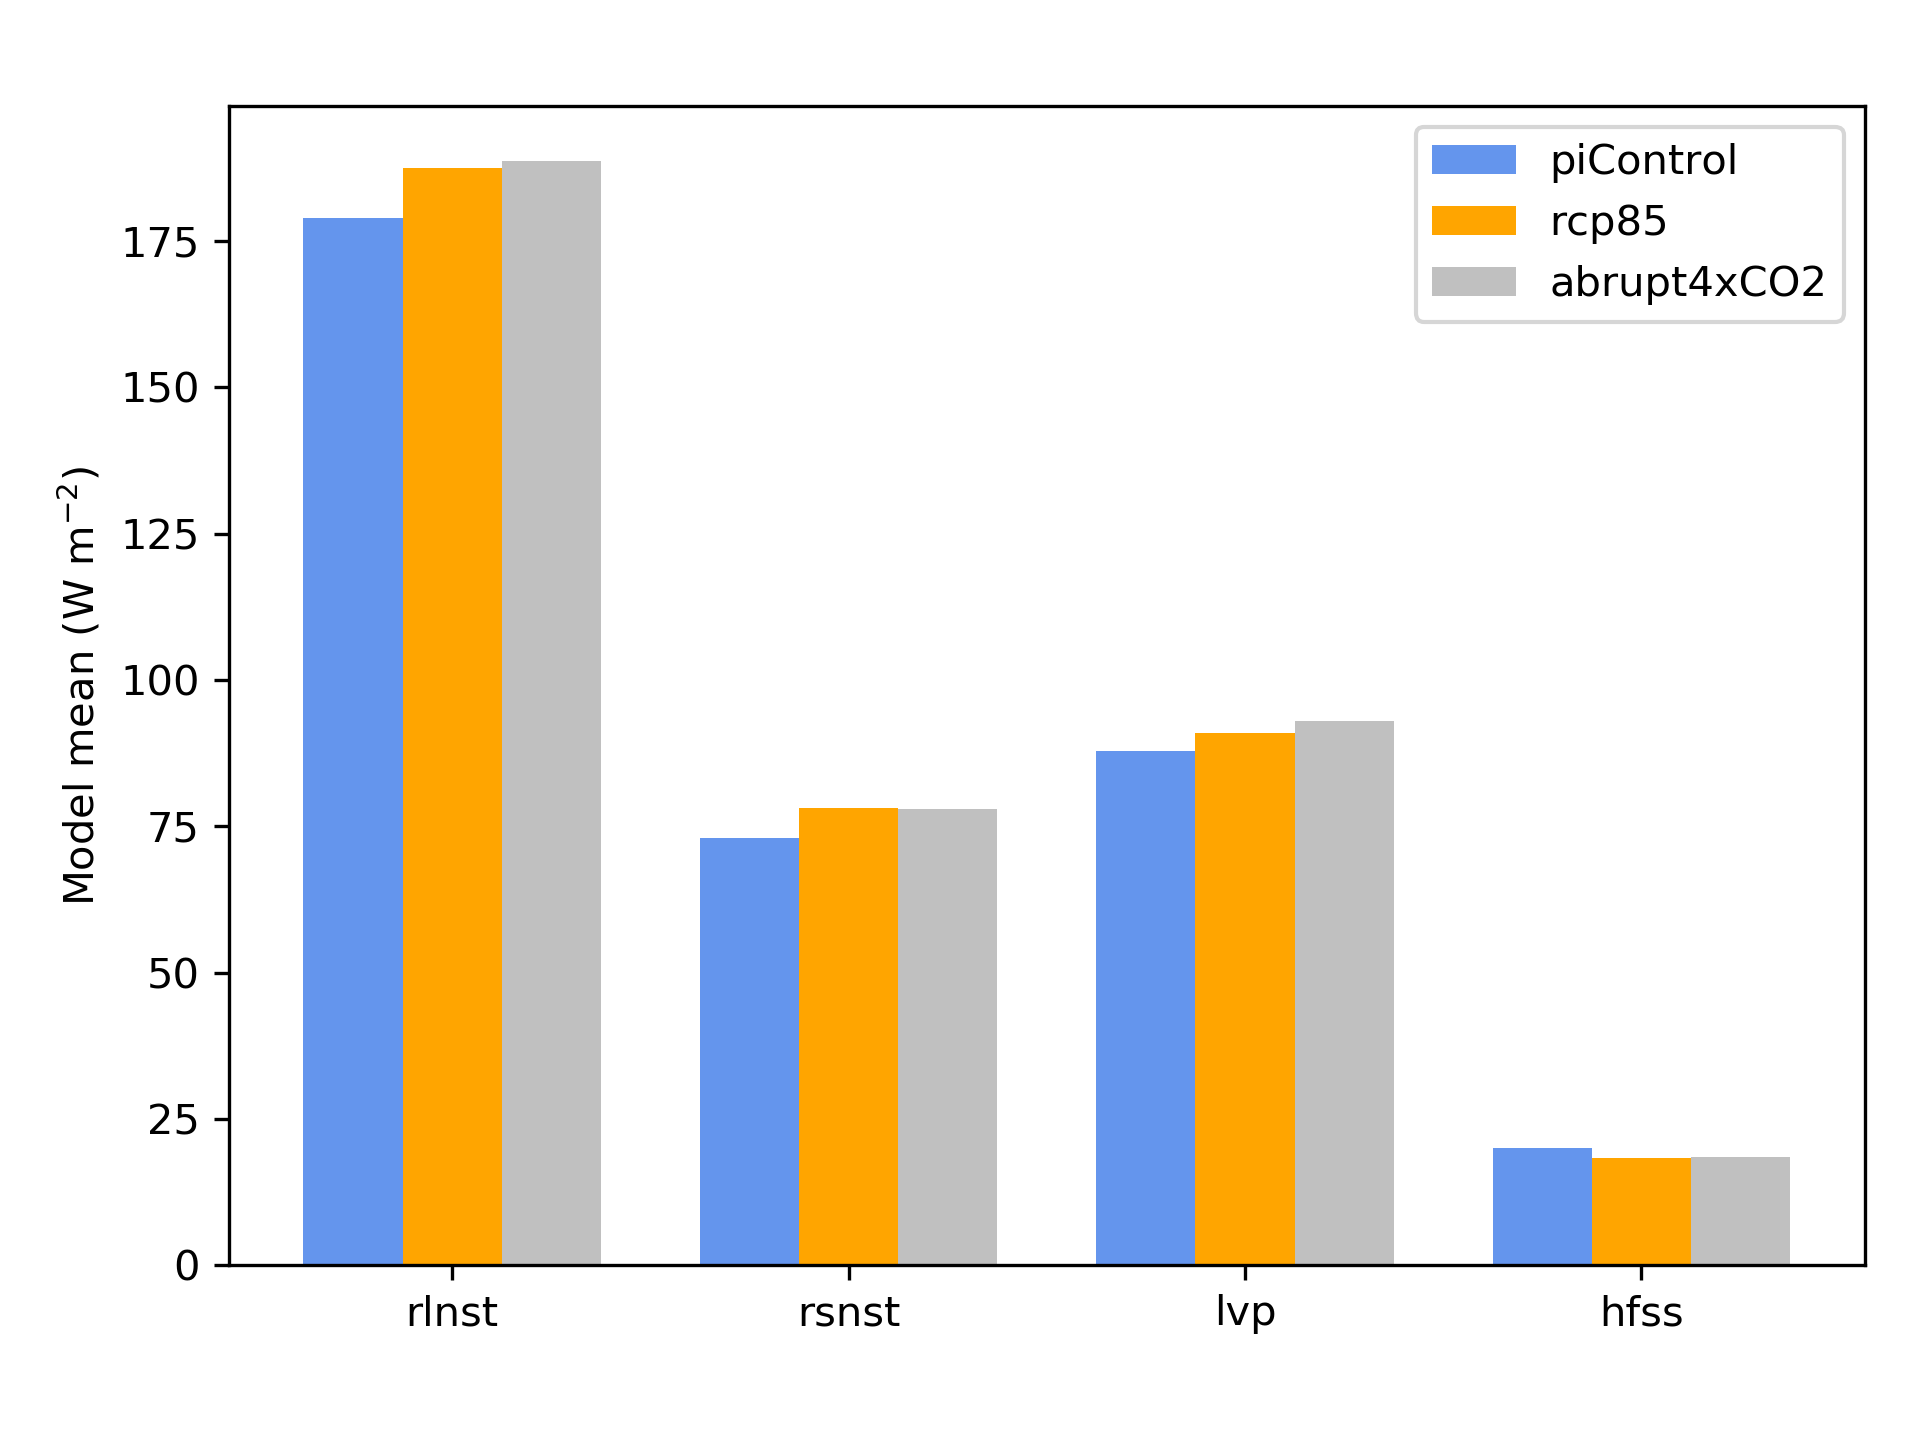
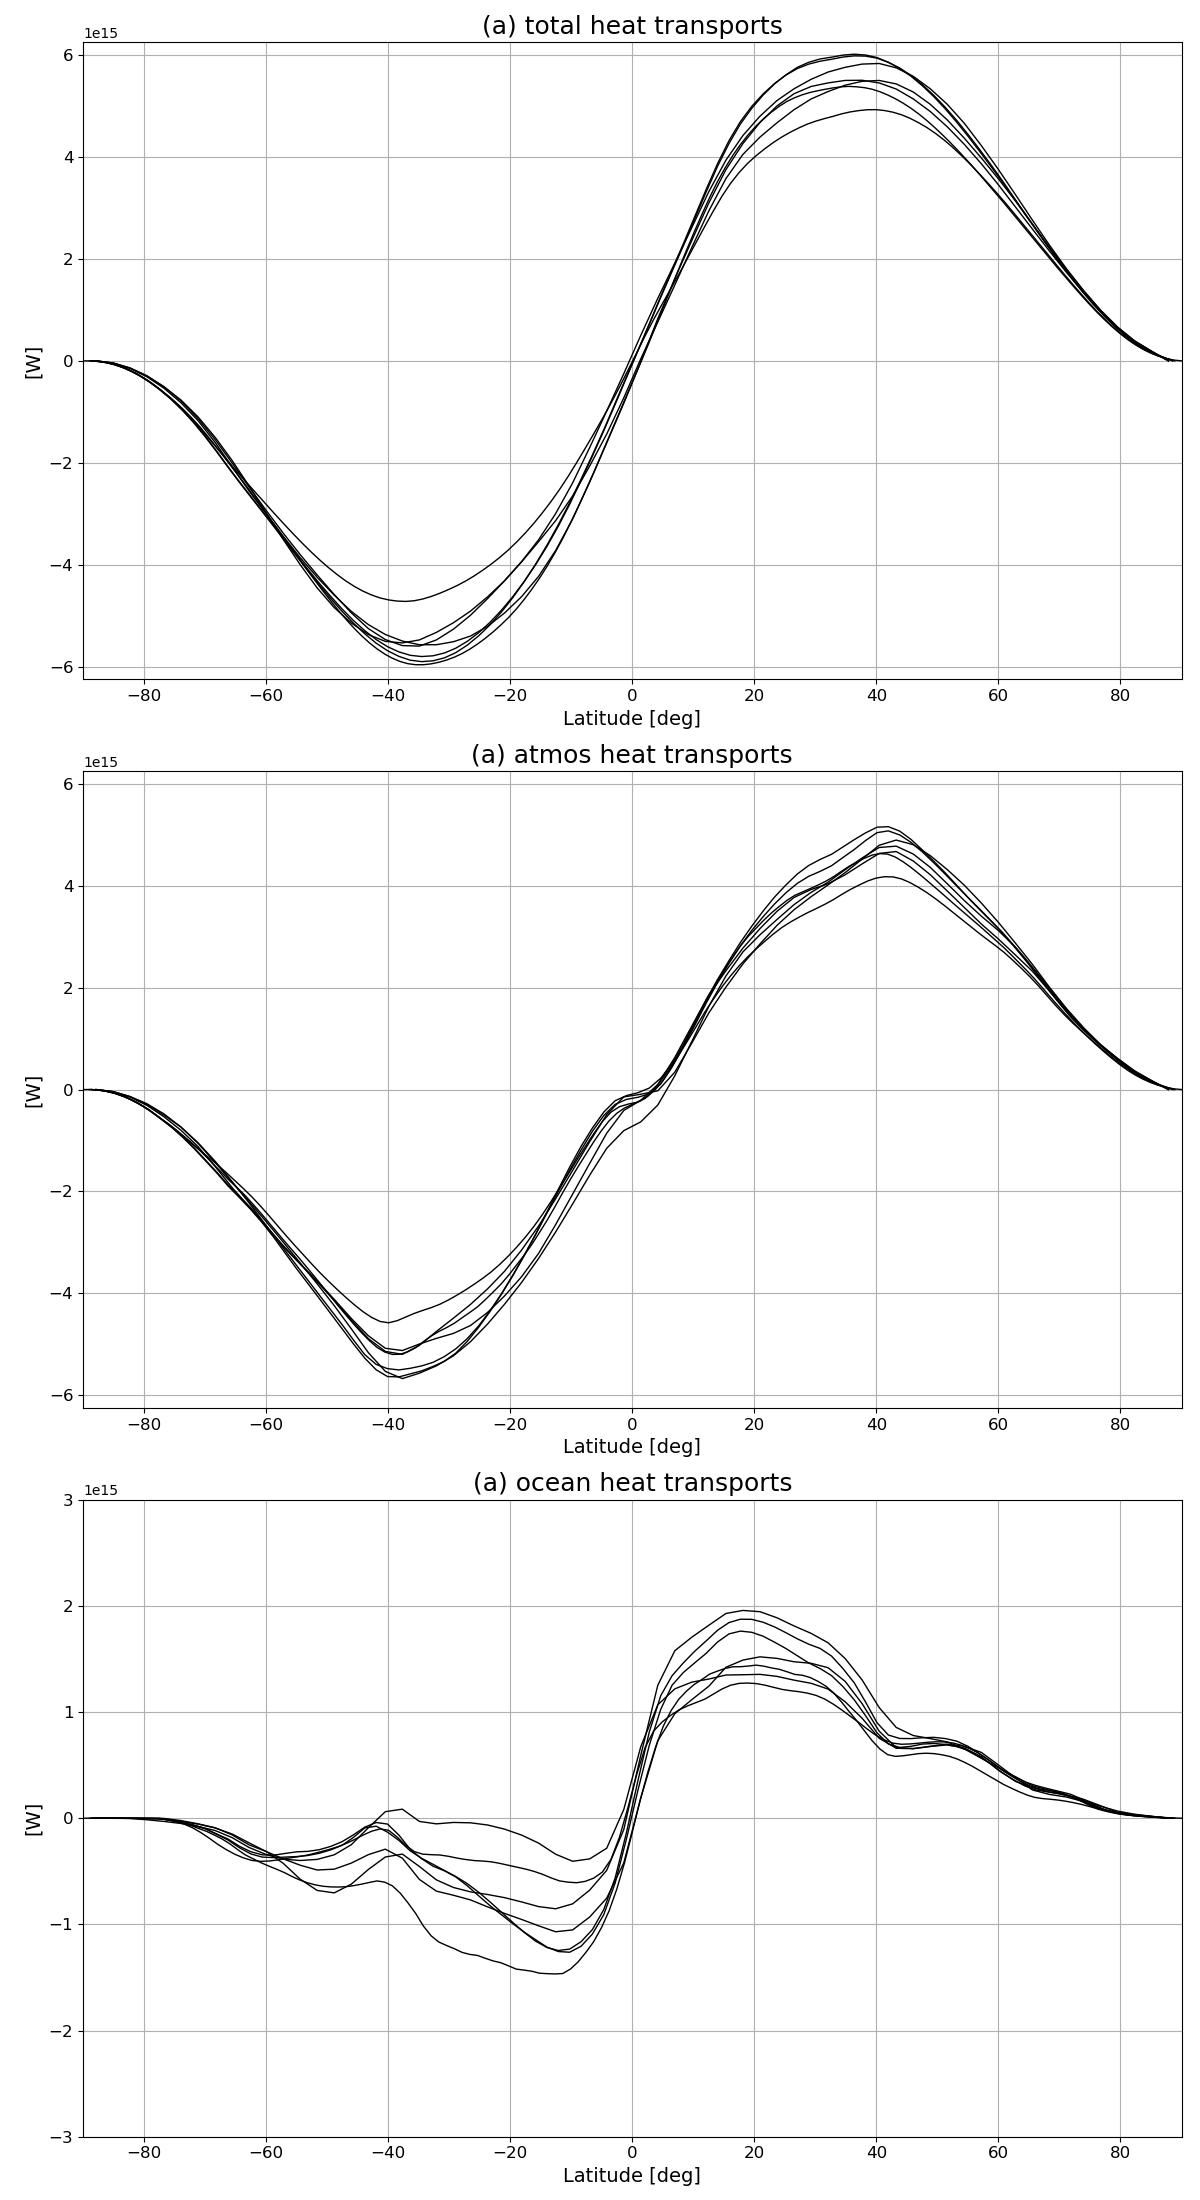
Thermodynamics of the Climate System - The Diagnostic Tool TheDiaTo v1.0
- 50
- 51
- 52
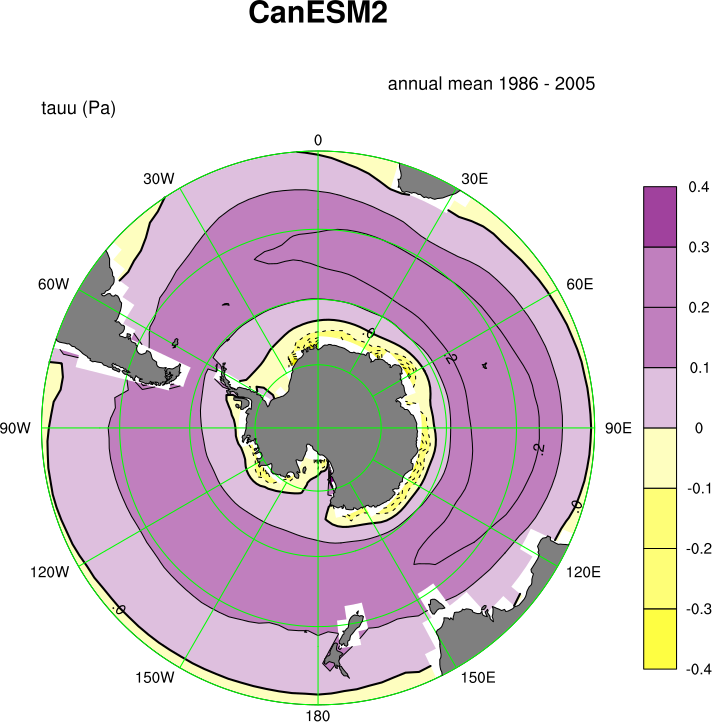
Multiple ensemble diagnostic regression (MDER) for constraining future austral jet position
- 53
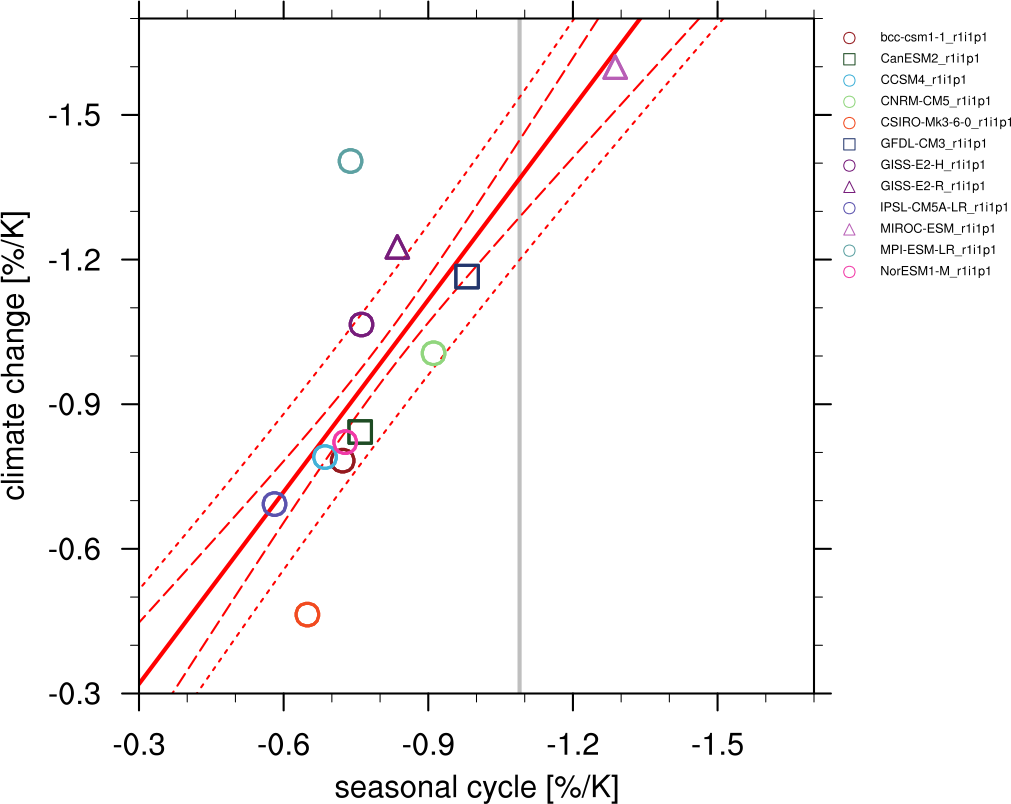
Projected land photosynthesis constrained by changes in the seasonal cycle of atmospheric CO2
- 54
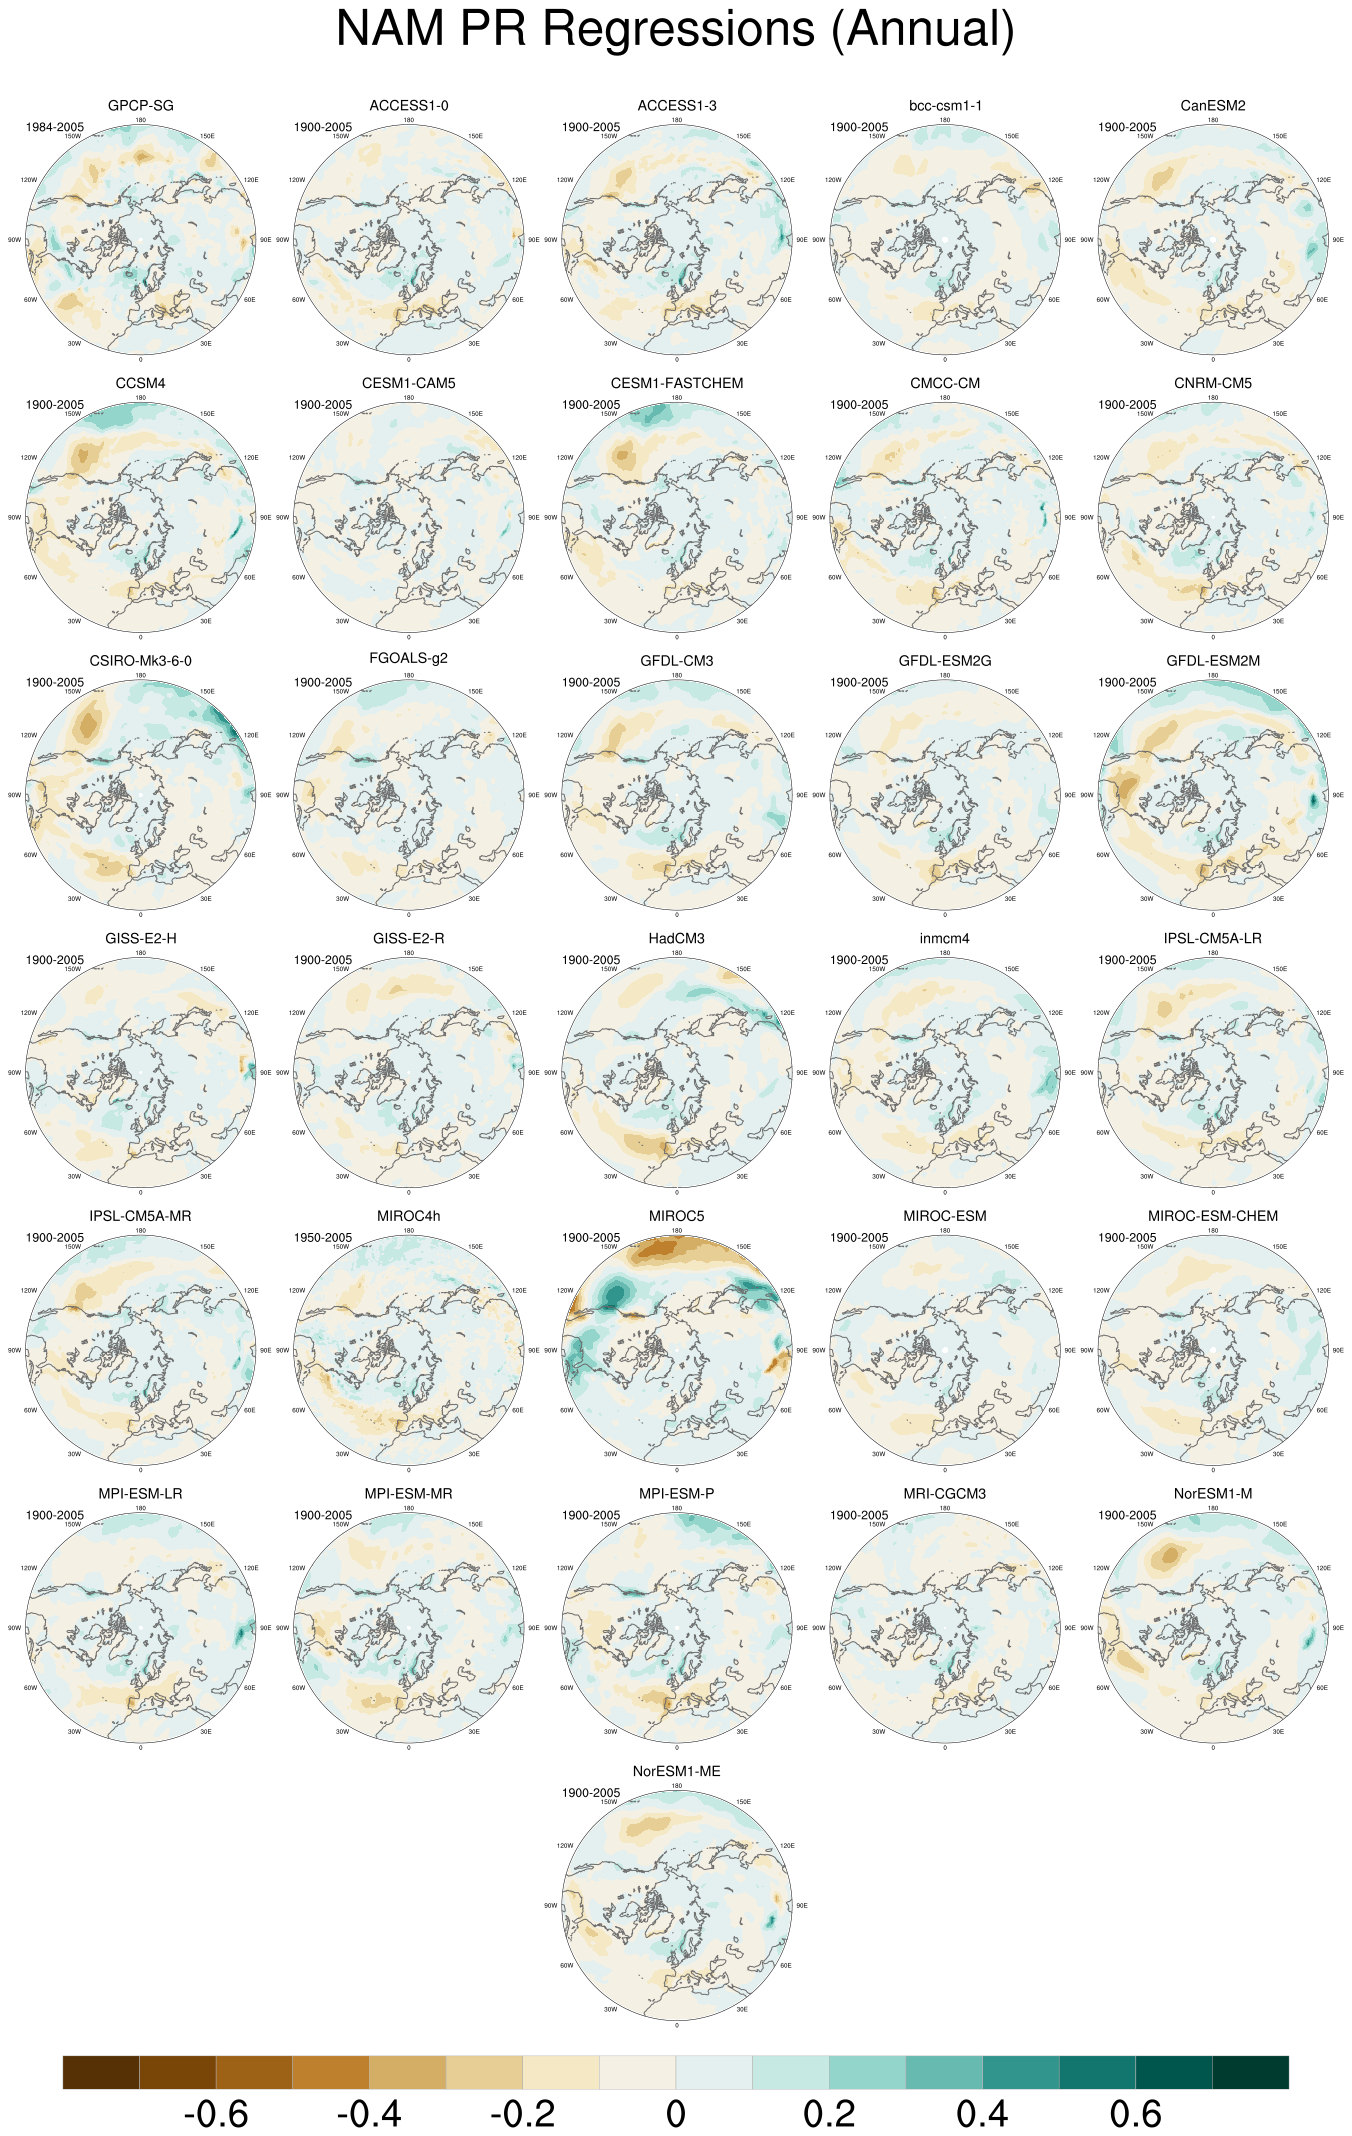
Stratosphere-troposphere coupling and annular modes indices (ZMNAM)
