Performance metrics for essential climate parameters
Overview
The goal is to create a standard recipe for the calculation of performance metrics to quantify the ability of the models to reproduce the climatological mean annual cycle for selected “Essential Climate Variables” (ECVs) plus some additional corresponding diagnostics and plots to better understand and interpret the results.
The recipe can be used to calculate performance metrics at different vertical levels (e.g., 5, 30, 200, 850 hPa as in Gleckler et al. (2008) and in different regions. As an additional reference, we consider Righi et al. (2015).
Available recipes and diagnostics
Recipes are stored in recipes/
recipe_perfmetrics_CMIP5.yml
recipe_perfmetrics_CMIP5_cds.yml
recipe_perfmetrics_land_CMIP5.yml
Diagnostics are stored in diag_scripts/perfmetrics/
main.ncl: calculates and (optionally) plots annual/seasonal cycles, zonal means, lat-lon fields and time-lat-lon fields. The calculated fields can also be plotted as difference w.r.t. a given reference dataset. main.ncl also calculates RMSD, bias and taylor metrics. Input data have to be regridded to a common grid in the preprocessor. Each plot type is created by a separated routine, as detailed below.
cycle.ncl: creates an annual/seasonal cycle plot.
zonal.ncl: creates a zonal (lat-pressure) plot.
latlon.ncl: creates a lat-lon plot.
cycle_latlon.ncl: precalculates the metrics for a time-lat-lon field, with different options for normalization.
collect.ncl: collects and plots the metrics previously calculated by cycle_latlon.ncl.
User settings in recipe
Script main.ncl
Required settings (scripts)
plot_type: cycle (time), zonal (plev, lat), latlon (lat, lon), cycle_latlon (time, lat, lon), cycle_zonal (time, plev, lat)
time_avg: type of time average (monthlyclim, seasonalclim, annualclim)
region: selected region (global, trop, nhext, shext, nhtrop, shtrop, nh, sh, nhmidlat, shmidlat, nhpolar, shpolar, eq)
Optional settings (scripts)
styleset: for plot_type cycle only (cmip5, righi15gmd, cmip6, default)
plot_stddev: for plot_type cycle only, plots standard deviation as shading
legend_outside: for plot_type cycle only, plots the legend in a separate file
t_test: for plot_type zonal or latlon, calculates t-test in difference plots (default: False)
conf_level: for plot_type zonal or latlon, adds the confidence level for the t-test to the plot (default: False)
projection: map projection for plot_type latlon (default: CylindricalEquidistant)
plot_diff: draws difference plots (default: False)
calc_grading: calculates grading metrics (default: False)
stippling: uses stippling to mark statistically significant differences (default: False = mask out non-significant differences in gray)
show_global_avg: diplays the global avaerage of the input field as string at the top-right of lat-lon plots (default: False)
metric: chosen grading metric(s) (if calc_grading is True)
normalization: metric normalization (for RMSD and BIAS metrics only)
abs_levs: list of contour levels for absolute plot
diff_levs: list of contour levels for difference plot
zonal_cmap: for plot_type zonal only, chosen color table (default: “amwg_blueyellowred”)
zonal_ymin: for plot_type zonal only, minimum pressure level on the y-axis (default: 5. hPa)
latlon_cmap: for plot_type latlon only, chosen color table (default: “amwg_blueyellowred”)
plot_units: plotting units (if different from standard CMOR units)
Required settings (variables)
reference_dataset: reference dataset to compare with (usually the observations).
Optional settings (variables)
alternative_dataset: a second dataset to compare with.
These settings are passed to the other scripts by main.ncl, depending on the selected plot_type.
Script collect.ncl
Required settings (scripts)
metric: selected metric (RMSD, BIAS or taylor)
label_bounds: for RMSD and BIAS metrics, min and max of the labelbar
label_scale: for RMSD and BIAS metrics, bin width of the labelbar
colormap: for RMSD and BIAS metrics, color table of the labelbar
Optional settings (scripts)
label_lo: adds lower triange for values outside range
label_hi: adds upper triange for values outside range
cm_interval: min and max color of the color table
cm_reverse: reverses the color table
sort: sorts datasets in alphabetic order (excluding MMM)
diag_order: sort diagnostics in a specific order (name = ‘diagnostic’-‘region’)
title: plots title
scale_font: scaling factor applied to the default font size
disp_values: switches on/off the grading values on the plot
disp_rankings: switches on/off the rankings on the plot
rank_order: displays rankings in increasing (1) or decreasing (-1) order
Variables
recipe_perfmetrics_CMIP5.yml
clt (atmos, monthly mean, longitude latitude time)
hus (atmos, monthly mean, longitude latitude lev time)
od550aer, od870aer, od550abs, od550lt1aer (aero, monthly mean, longitude latitude time)
pr (atmos, monthly mean, longitude latitude time)
rlut, rlutcs, rsut, rsutcs (atmos, monthly mean, longitude latitude time)
sm (land, monthly mean, longitude latitude time)
ta (atmos, monthly mean, longitude latitude lev time)
tas (atmos, monthly mean, longitude latitude time)
toz (atmos, monthly mean, longitude latitude time)
ts (atmos, monthly mean, longitude latitude time)
ua (atmos, monthly mean, longitude latitude lev time)
va (atmos, monthly mean, longitude latitude lev time)
zg (atmos, monthly mean, longitude latitude lev time)
recipe_perfmetrics_land_CMIP5.yml
sm (land, monthly mean, longitude latitude time)
nbp (land, monthly mean, longitude latitude time)
gpp (land, monthly mean, longitude latitude time)
lai (land, monthly mean, longitude latitude time)
fgco2 (ocean, monthly mean, longitude latitude time)
et (land, monthly mean, longitude latitude time)
rlus, rlds, rsus, rdsd (atmos, monthly mean, longitude latitude time)
Observations and reformat scripts
The following list shows the currently used observational data sets for this recipe with their variable names and the reference to their respective reformat scripts in parentheses. Please note that obs4MIPs data can be used directly without any reformating. For non-obs4MIPs data use esmvaltool data info DATASET or see headers of cmorization scripts (in /esmvaltool/cmorizers/data/formatters/datasets/) for downloading and processing instructions. #. recipe_perfmetrics_CMIP5.yml
AIRS (hus - obs4MIPs)
CERES-EBAF (rlut, rlutcs, rsut, rsutcs - obs4MIPs)
ERA-Interim (tas, ta, ua, va, zg, hus - esmvaltool/cmorizers/data/formatters/datasets/era-interim.py)
ESACCI-AEROSOL (od550aer, od870aer, od550abs, od550lt1aer - esmvaltool/cmorizers/data/formatters/datasets/esacci-aerosol.ncl)
ESACCI-CLOUD (clt - esmvaltool/cmorizers/data/formatters/datasets/esacci-cloud.ncl)
ESACCI-OZONE (toz - esmvaltool/cmorizers/data/formatters/datasets/esacci-ozone.ncl)
ESACCI-SOILMOISTURE (sm - esmvaltool/cmorizers/data/formatters/datasets/esacci_soilmoisture.ncl)
ESACCI-SST (ts - esmvaltool/ucmorizers/data/formatters/datasets/esacci-sst.py)
GPCP-SG (pr - obs4MIPs)
HadISST (ts - esmvaltool/cmorizers/data/formatters/datasets/hadisst.ncl)
MODIS (od550aer - esmvaltool/cmorizers/data/formatters/datasets/modis.ncl)
NCEP (tas, ta, ua, va, zg - esmvaltool/cmorizers/data/formatters/datasets/ncep.ncl)
NIWA-BS (toz - esmvaltool/cmorizers/data/formatters/datasets/niwa_bs.ncl)
PATMOS-x (clt - esmvaltool/cmorizers/data/formatters/datasets/patmos_x.ncl)
recipe_perfmetrics_land_CMIP5.yml
CERES-EBAF (rlus, rlds, rsus, rsds - obs4MIPs)
ESACCI-SOILMOISTURE (sm - esmvaltool/cmorizers/data/formatters/datasets/esacci_soilmoisture.ncl)
FLUXCOM (gpp - esmvaltool/cmorizers/data/formatters/datasets/fluxcom.py)
JMA-TRANSCOM (nbp, fgco2 - esmvaltool/cmorizers/data/formatters/datasets/jma_transcom.py)
LAI3d (lai - esmvaltool/cmorizers/data/formatters/datasets/lai3g.py)
LandFlux-EVAL (et - esmvaltool/cmorizers/data/formatters/datasets/landflux_eval.py)
Landschuetzer2016 (fgco2 - esmvaltool/cmorizers/data/formatters/datasets/landschuetzer2016.py)
MTE (gpp - esmvaltool/cmorizers/data/formatters/datasets/mte.py)
References
Gleckler, P. J., K. E. Taylor, and C. Doutriaux, Performance metrics for climate models, J. Geophys. Res., 113, D06104, doi: 10.1029/2007JD008972 (2008).
Righi, M., Eyring, V., Klinger, C., Frank, F., Gottschaldt, K.-D., Jöckel, P., and Cionni, I.: Quantitative evaluation of oone and selected climate parameters in a set of EMAC simulations, Geosci. Model Dev., 8, 733, doi: 10.5194/gmd-8-733-2015 (2015).
Example plots
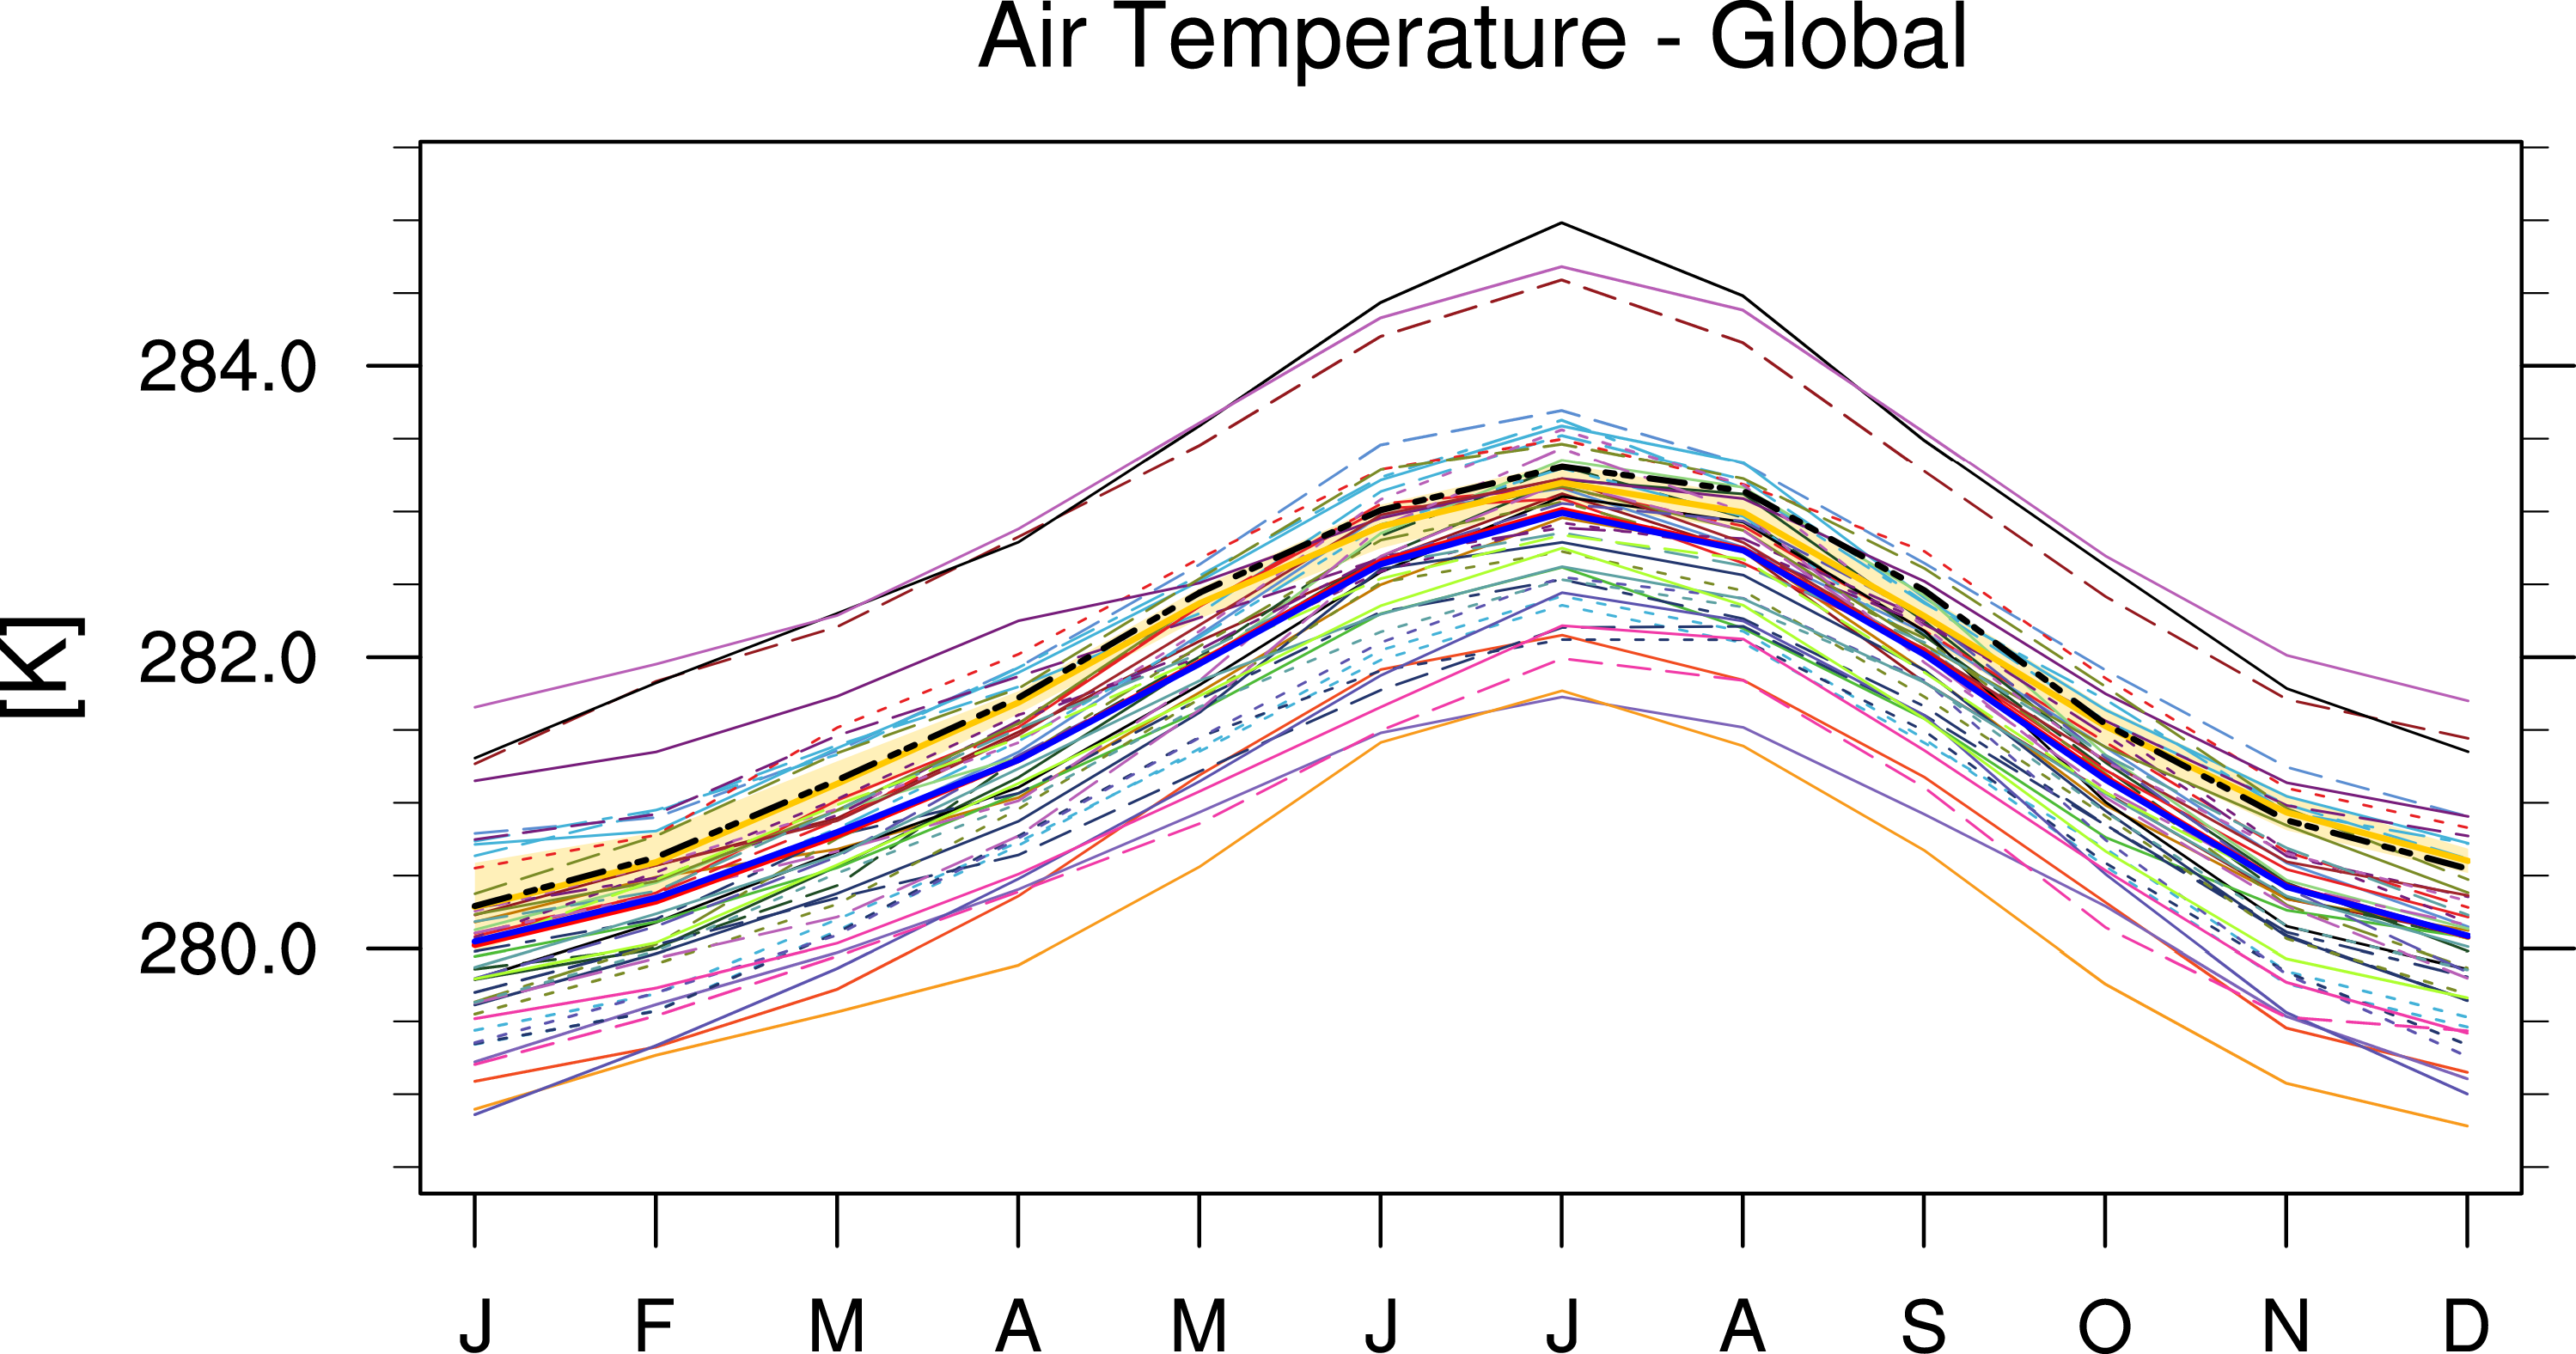
Fig. 63 Annual cycle of globally averaged temperature at 850 hPa (time period 1980-2005) for different CMIP5 models (historical simulation) (thin colored lines) in comparison to ERA-Interim (thick yellow line) and NCEP (thick black dashed line) reanalysis data.
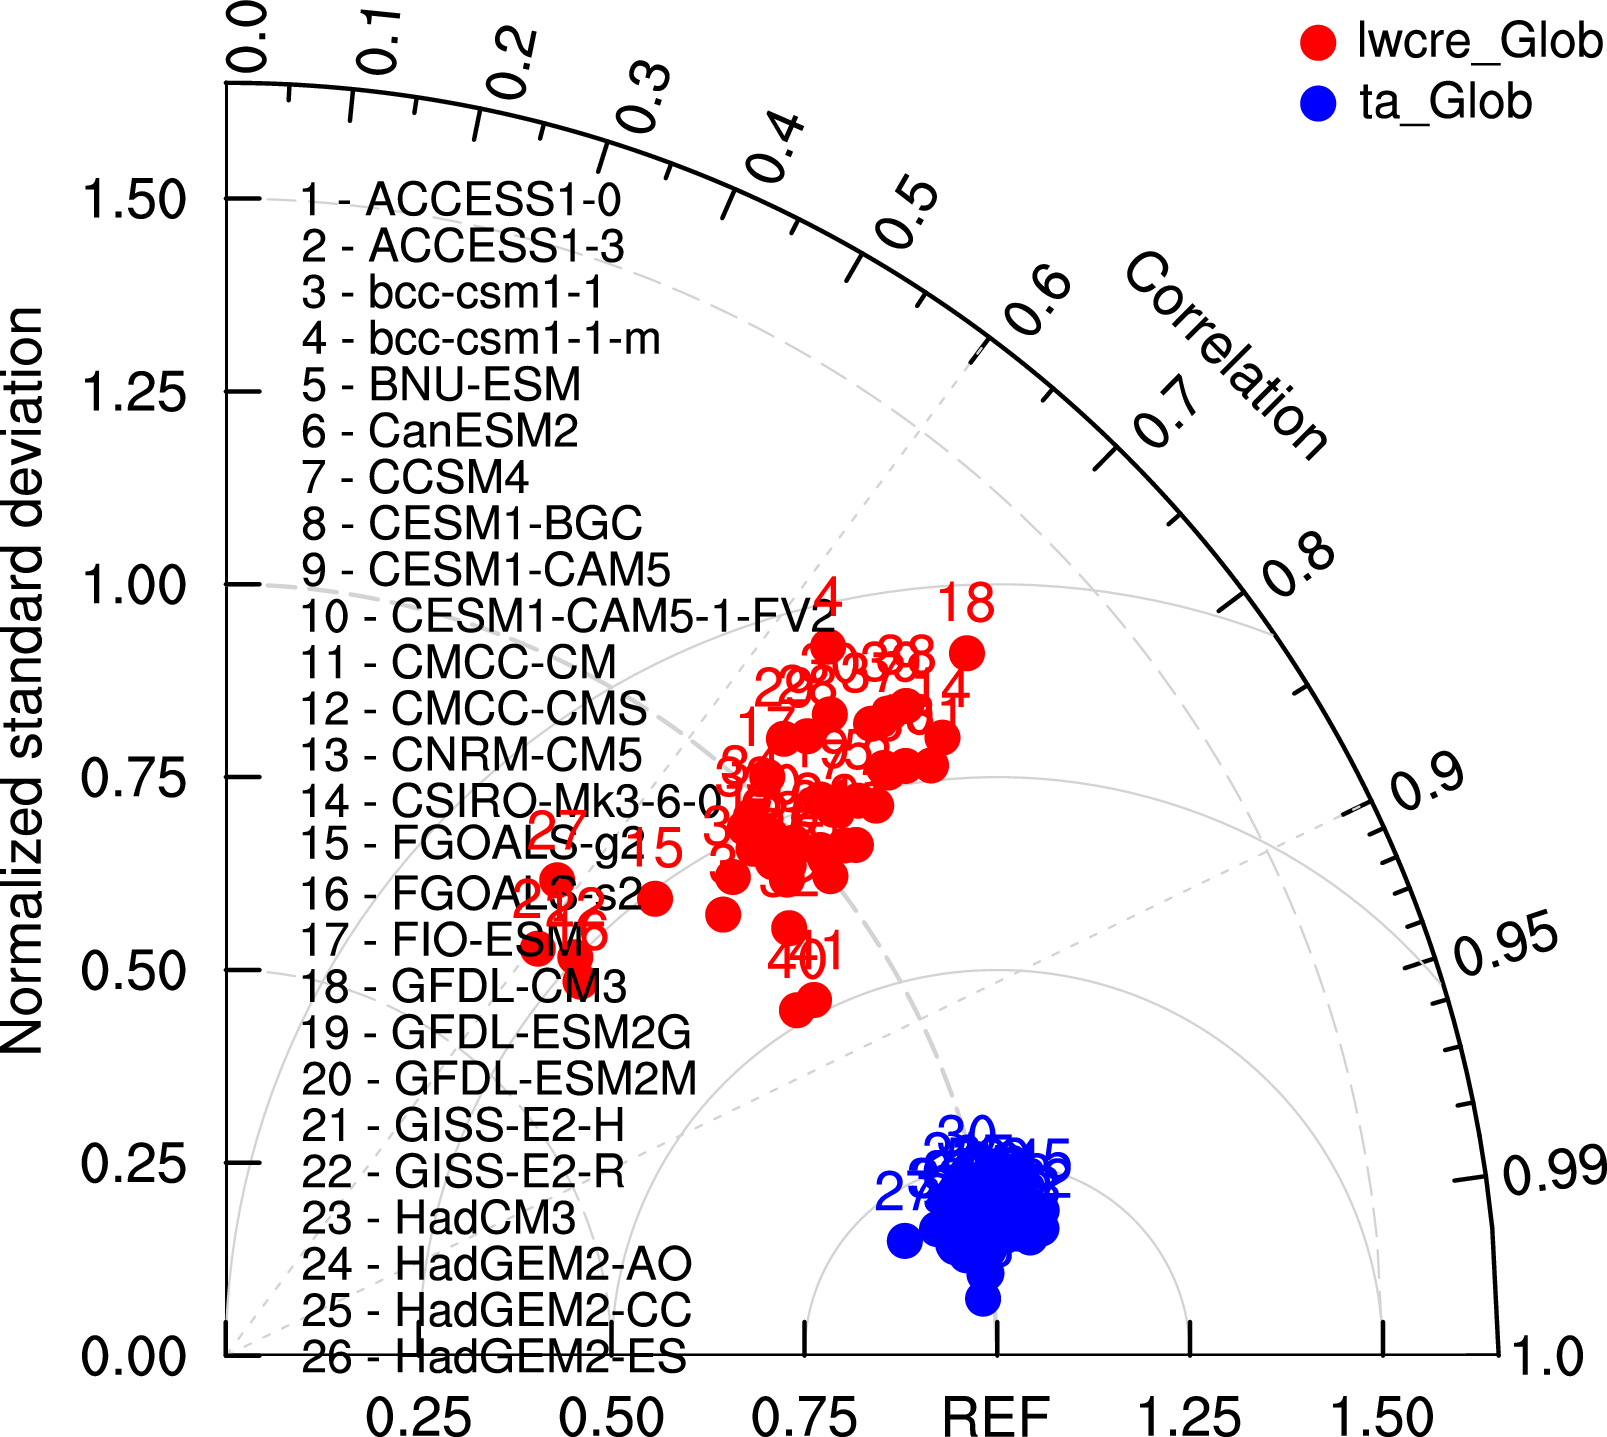
Fig. 64 Taylor diagram of globally averaged temperature at 850 hPa (ta) and longwave cloud radiative effect (lwcre) for different CMIP5 models (historical simulation, 1980-2005). Reference data (REF) are ERA-Interim for temperature (1980-2005) and CERES-EBAF (2001-2012) for longwave cloud radiative effect.
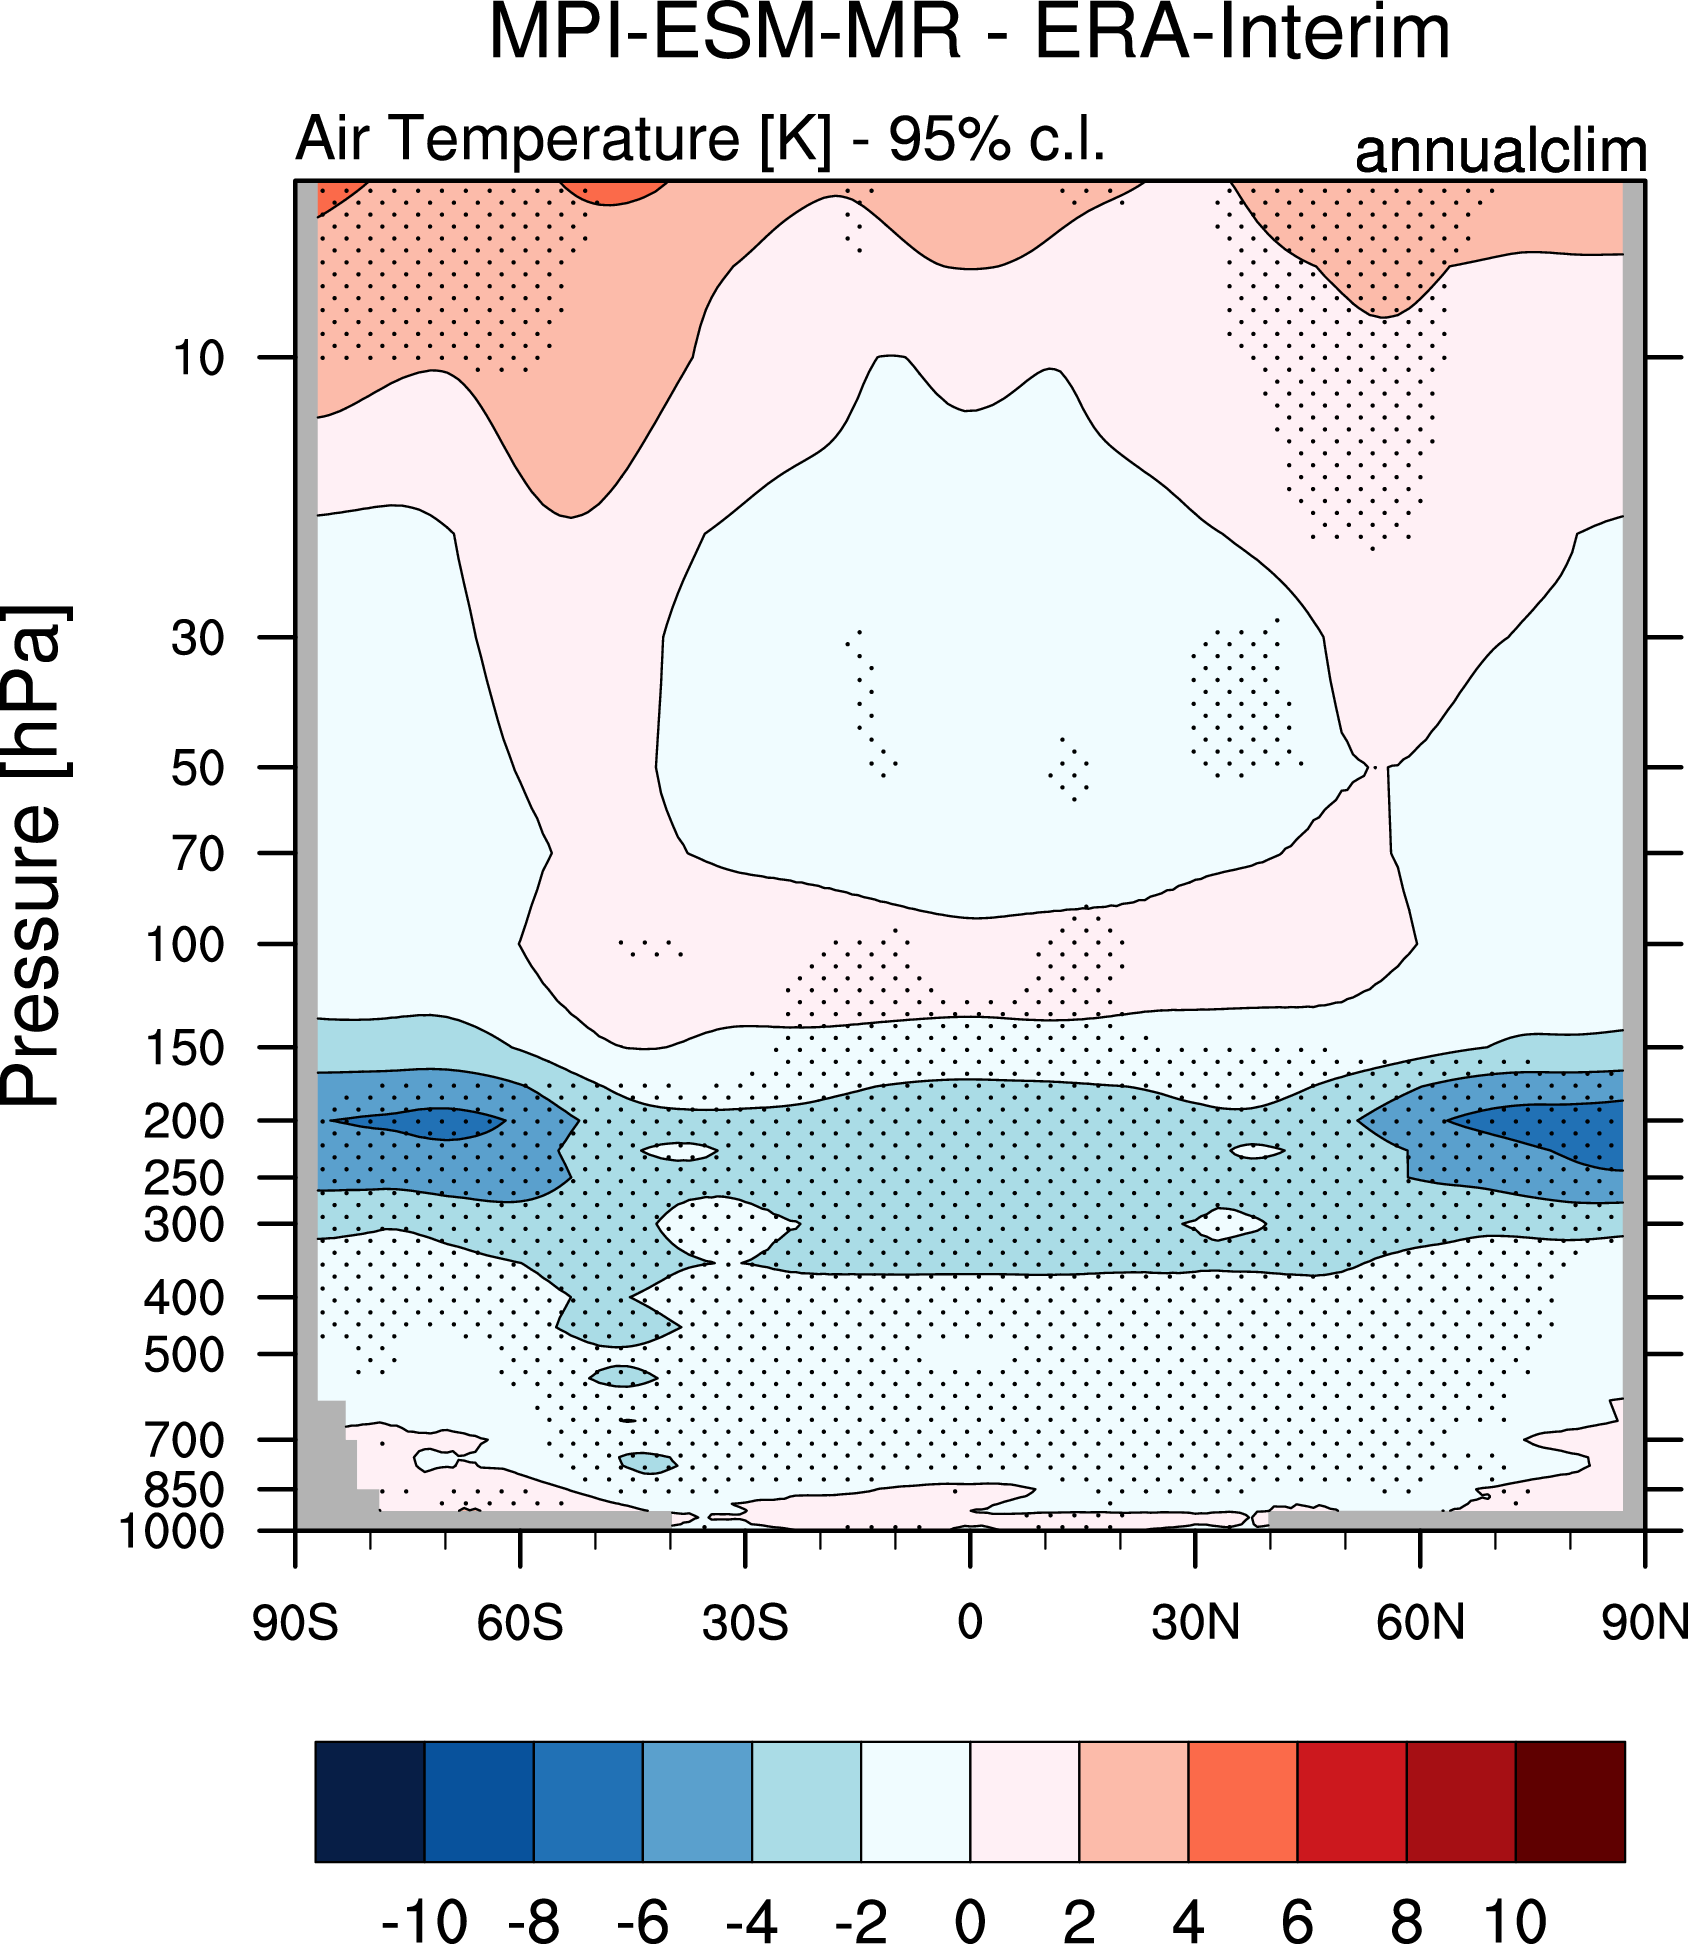
Fig. 65 Difference in annual mean of zonally averaged temperature (time period 1980-2005) between the CMIP5 model MPI-ESM-MR (historical simulation) and ERA-Interim. Stippled areas indicdate differences that are statistically significant at a 95% confidence level.
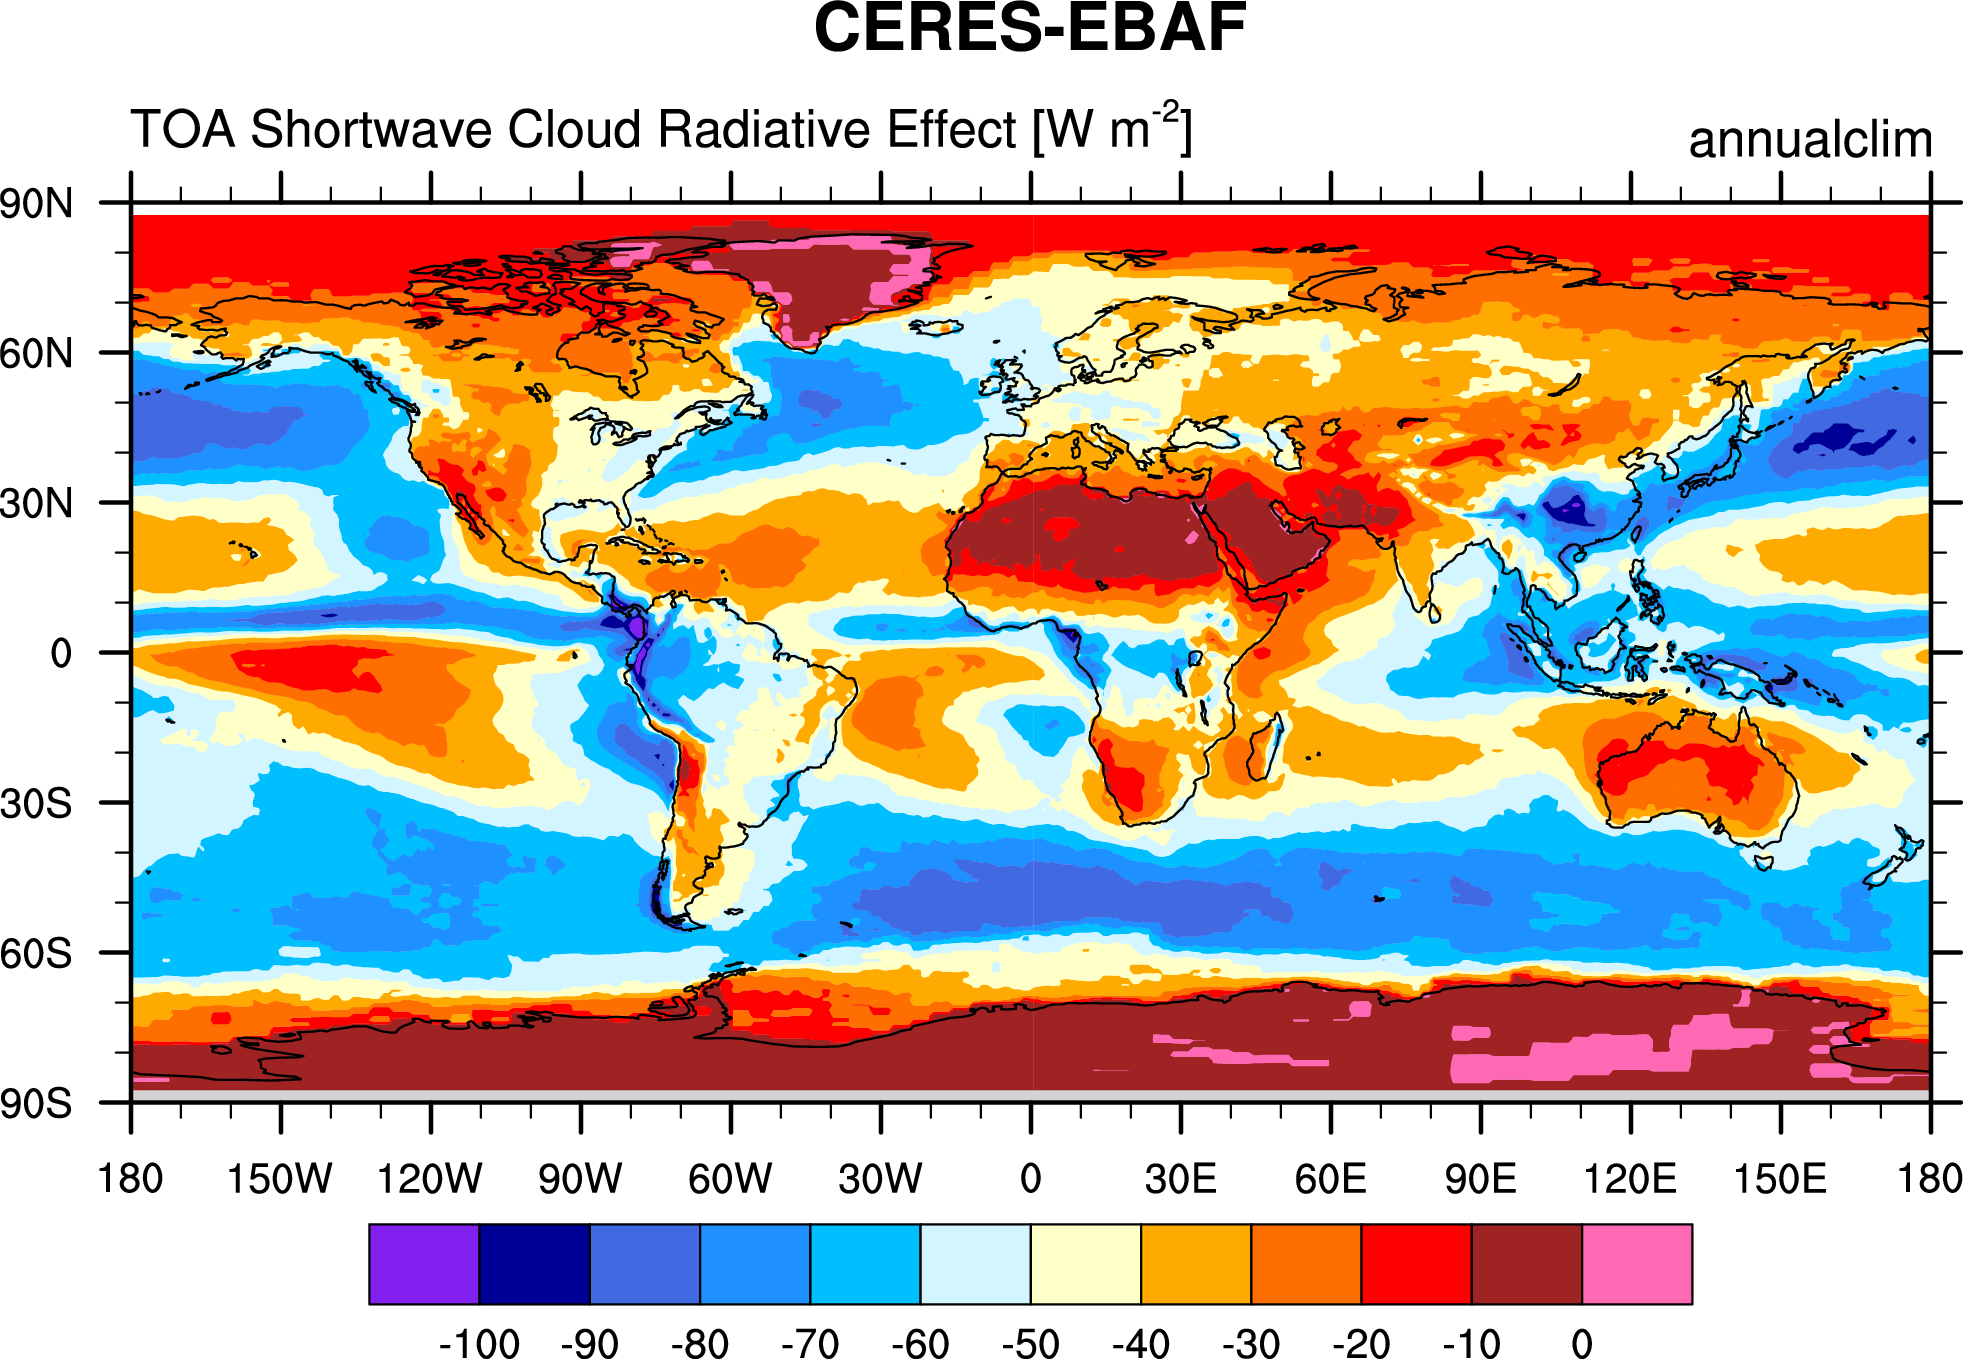
Fig. 66 Annual mean (2001-2012) of the shortwave cloud radiative effect from CERES-EBAF.
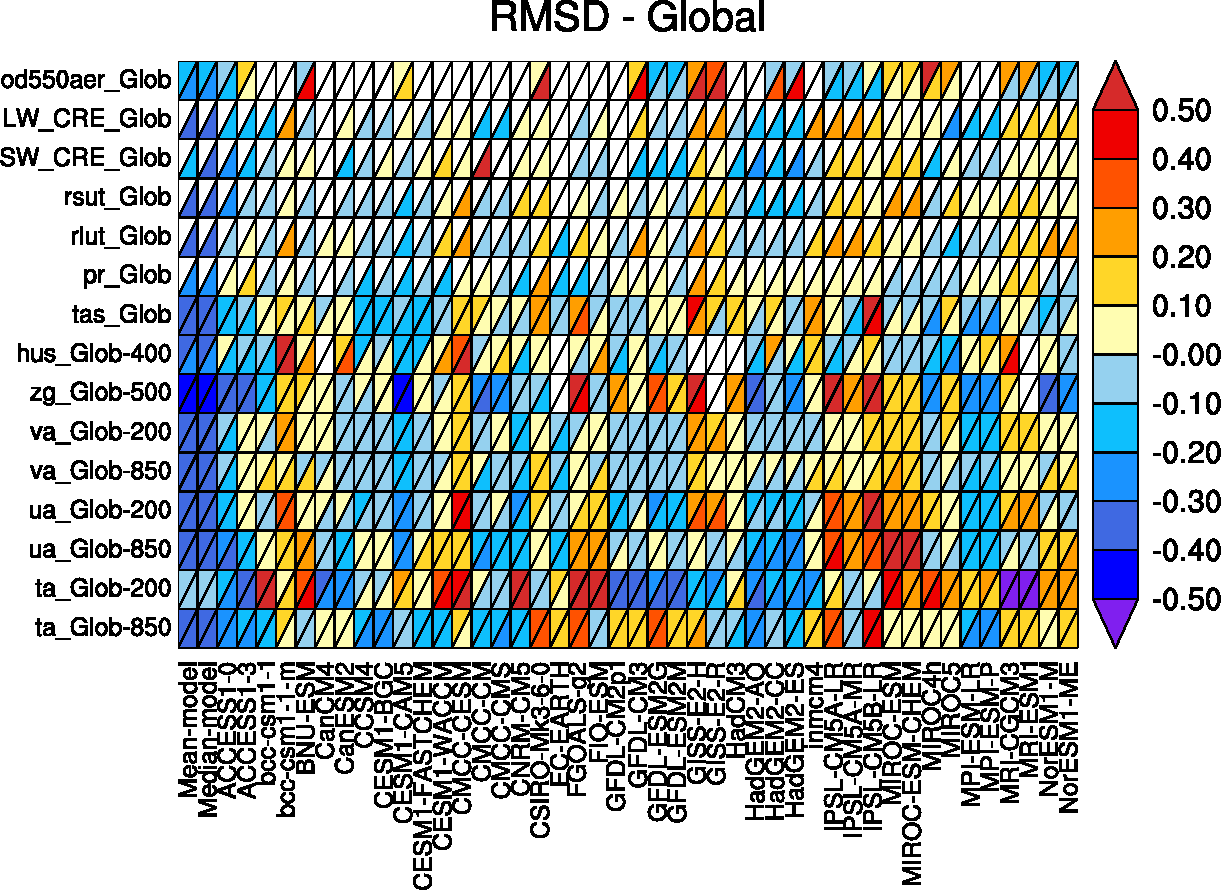
Fig. 67 Relative space-time root-mean-square deviation (RMSD) calculated from the climatological seasonal cycle of CMIP5 simulations. A relative performance is displayed, with blue shading indicating better and red shading indicating worse performance than the median of all model results. A diagonal split of a grid square shows the relative error with respect to the reference data set (lower right triangle) and the alternative data set (upper left triangle). White boxes are used when data are not available for a given model and variable.