Monitor
Overview
Available recipes and diagnostics
Recipes are stored in recipes/
recipe_monitor.yml
Diagnostics are stored in diag_scripts/monitor/
monitor.py: Plots preprocessor output directly from the preprocessor.
compute_eofs.py: An example on how to use the monitor structure to show other metrics. Computes and plots the map of the first EOF and the associated PC timeseries.
List of plot types available in monitor.py
Climatology (plot_type clim): Plots climatology. Supported coordinates: (latitude, longitude, month_number).
Seasonal climatologies (plot_type seasonclim): It produces a multi panel (2x2) plot with the seasonal climatologies. Supported coordinates: (latitude, longitude, month_number).
Monthly climatologies (plot_type monclim): It produces a multi panel (3x4) plot with the monthly climatologies. Can be customized to show only certain months and to rearrange the number of columns and rows. Supported coordinates: (latitude, longitude, month_number).
Time series (plot_type timeseries): Generate time series plots. It will always generate the full period time series, but if the period is longer than 75 years, it will also generate two extra time series for the first and last 50 years. It will produce multi panel plots for data with shape_id or region coordinates of length > 1. Supported coordinates: time, shape_id (optional) and region (optional).
Annual cycle (plot_type annual_cycle): Generate an annual cycle plot (timeseries like climatological from January to December). It will produce multi panel plots for data with shape_id or region coordinates of length > 1. Supported coordinates: time, shape_id (optional) and region (optional).
User settings
User setting files are stored in recipes and in a dedicated yaml config file.
In the variable definitions, users can set the attribute plot_name to fix the variable name that will be used for the plot’s title. If it is not set, mapgenerator will try to choose a sensible one from the standard name attributes (long_name, standard_name and var_name).
monitor.py
plots: a dictionary containing the plots to make, with its own options. Available types of plot are listed in section List of plot types available in monitor.py.
cartopy_data_dir: Path to cartopy data dir. Defaults to None. See https://scitools.org.uk/cartopy/docs/latest/cartopy.html.
plot_folder: Path to the folder to store the figures. It is defined as the input paths in
config-developer.yml. See https://docs.esmvaltool.org/projects/ESMValCore/en/latest/quickstart/configure.html#input-file-paths for more details. Defaults to~/plots/{dataset}/{exp}/{modeling_realm}/{real_name}.plot_filename: Filename pattern for the plots. It is defined as the input files in in
config-developer.yml. See https://docs.esmvaltool.org/projects/ESMValCore/en/latest/quickstart/configure.html#input-file-paths for more details. Defaults to{plot_type}_{real_name}_{dataset}_{mip}_{exp}_{ensemble}.config_file: Path to the monitor config file. Defaults to
monitor_config.ymlin the same folder as the diagnostic script.
Plot specific options:
- monclim:
maps: List of maps to plot, as defined in the config file. Defaults to
[global].months: Select only specific months. Defaults to
None(i.e. it does not select any month).plot_size: Size of each individual figure. Default’s to
(5, 4).columns: Number of columns in the plot. Defaults to
3.rows: Number of rows in the plot. Defaults to
4.
- seasonclim:
maps: List of maps to plot, as defined in the config file. Defaults to
[global].
- clim:
maps: List of maps to plot, as defined in the config file. Defaults to
[global].
annual_cycle: No options.
timeseries: No options.
compute_eofs.py
cartopy_data_dir: Path to cartopy data dir. Defaults to None. See https://scitools.org.uk/cartopy/docs/latest/cartopy.html.
plot_folder: Path to the folder to store the figures. It is defined as the input paths in
config-developer.yml. See https://docs.esmvaltool.org/projects/ESMValCore/en/latest/quickstart/configure.html#input-file-paths for more details. Defaults to~/plots/{dataset}/{exp}/{modeling_realm}/{real_name}.plot_filename: Filename pattern for the plots. It is defined as the input files in in
config-developer.yml. See https://docs.esmvaltool.org/projects/ESMValCore/en/latest/quickstart/configure.html#input-file-paths for more details. Defaults to{plot_type}_{real_name}_{dataset}_{mip}_{exp}_{ensemble}.config_file: Path to the monitor config file. Defaults to
monitor_config.ymlin the same folder as the diagnostic script.
Hint
Extra arguments are ignored, so it is safe to use yaml anchors to share the configuration of common arguments with the monitor.py diagnostic script.
monitor_config.yml
A yaml file containing map and variable specific options.
Contains two dictionaries, maps and variables.
Each entry in maps corresponds to a map definition. See below for a sample with
comments to define each option
maps:
   global: # Map name, choose a meaningful one
      projection: PlateCarree # Cartopy projection to use
      projection_kwargs: # Dictionary with Cartopy's projection keyword arguments.
         central_longitude: 285
      smooth: true # If true, interpolate values to get smoother maps. If not, all points in a cells will get the exact same color
      lon: [-120, -60, 0, 60, 120, 180] # Set longitude ticks
      lat: [-90, -60, -30, 0, 30, 60, 90] # Set latitude ticks
      colorbar_location: bottom
      extent: null # If defined, restrict the projection to a region. Format [lon1, lon2, lat1, lat2]
      suptitle_pos: 0.87 # Title position in the figure.
Each entry in variable corresponds to a variable definition.
Use the default entry to apply generic options to all variables.
See below a sample with comments to define each option
variables:
   # Define default. Variable definitions completely override the default
   # not just the values defined. If you want to override only the defined
   # values, use yaml anchors as shown
   default: &default
      colors: RdYlBu_r # Matplotlib colormap to use for the colorbar
      N: 20 # Number of map intervals to plot
      bad: [0.9, 0.9, 0.9] # Color to use when no data
   pr:
      <<: *default
      colors: gist_earth_r
      # Define bounds of the colorbar, as a list of
      bounds: 0-10.5,0.5 # Set colorbar bounds, as a list or in the format min-max,interval
      extend: max # Set extend parameter of mpl colorbar. See https://matplotlib.org/stable/api/_as_gen/matplotlib.pyplot.colorbar.html
   sos:
      # If default is defined, entries are treated as map specific option.
      # Missing values in map definitionas are taken from variable's default
      # definition
      default:
         <<: *default
         bounds: 25-41,1
         extend: both
      arctic:
         bounds: 25-40,1
      antarctic:
         bounds: 30-40,0.5
   nao: &nao
      <<: *default
      extend: both
      # Variable definitions can override map parameters. Use with caution.
      bounds: [-0.03, -0.025, -0.02, -0.015, -0.01, -0.005, 0., 0.005, 0.01, 0.015, 0.02, 0.025, 0.03]
      projection: PlateCarree
      smooth: true
      lon: [-90, -60, -30, 0, 30]
      lat: [20, 40, 60, 80]
      colorbar_location: bottom
      suptitle_pos: 0.87
   sam:
      <<: *nao
      lat: [-90, -80, -70, -60, -50]
      projection: SouthPolarStereo
      projection_kwargs:
         central_longitude: 270
      smooth: true
      lon: [-120, -60, 0, 60, 120, 180]
Variables
Any, but the variables’ number of dimensions should match the ones expected by each plot.
Example plots
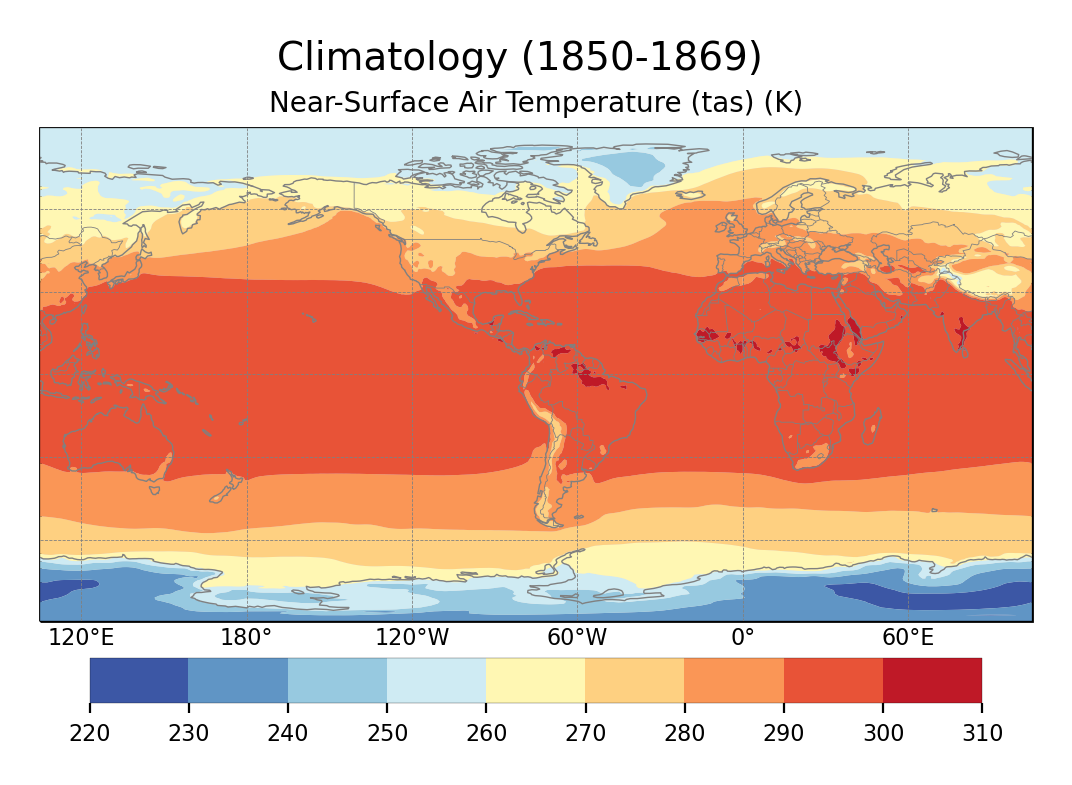
Global climatology of tas.
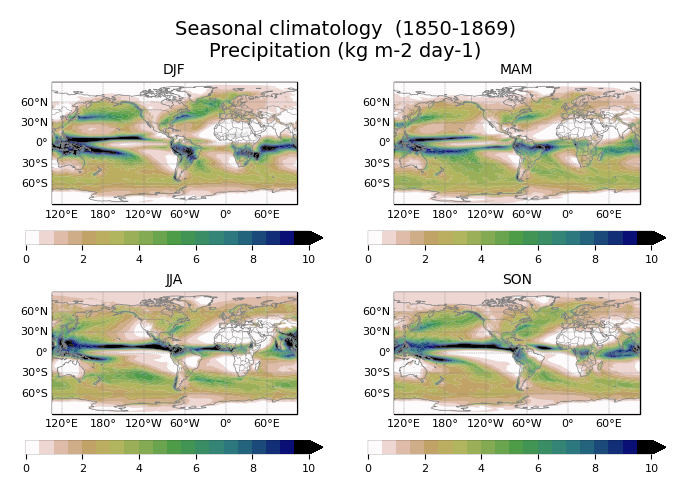
Seasonal climatology of pr, with a custom colorbar.
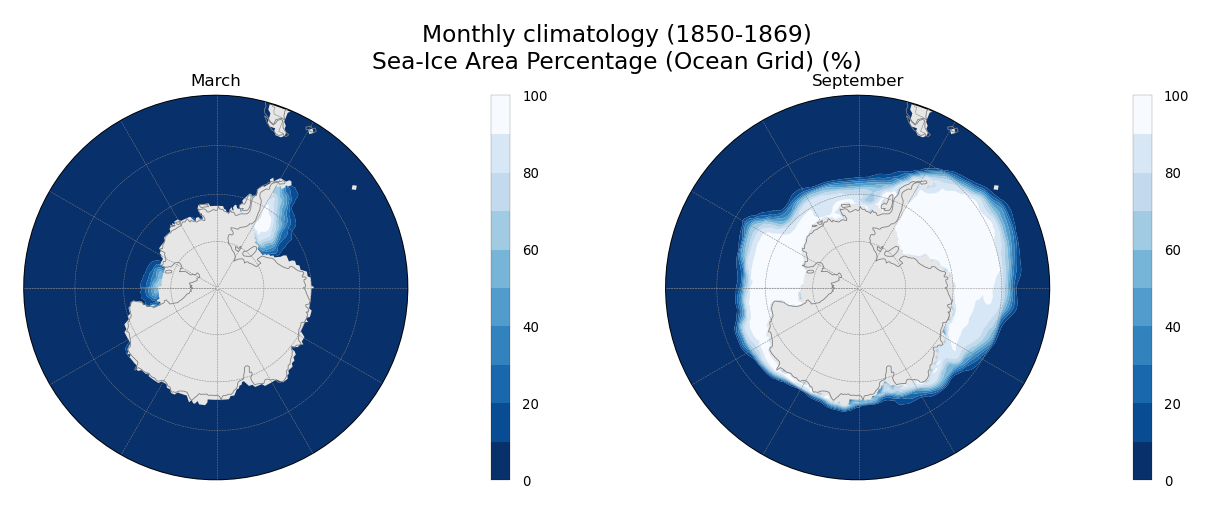
Monthly climatology of sivol, only for March and September.
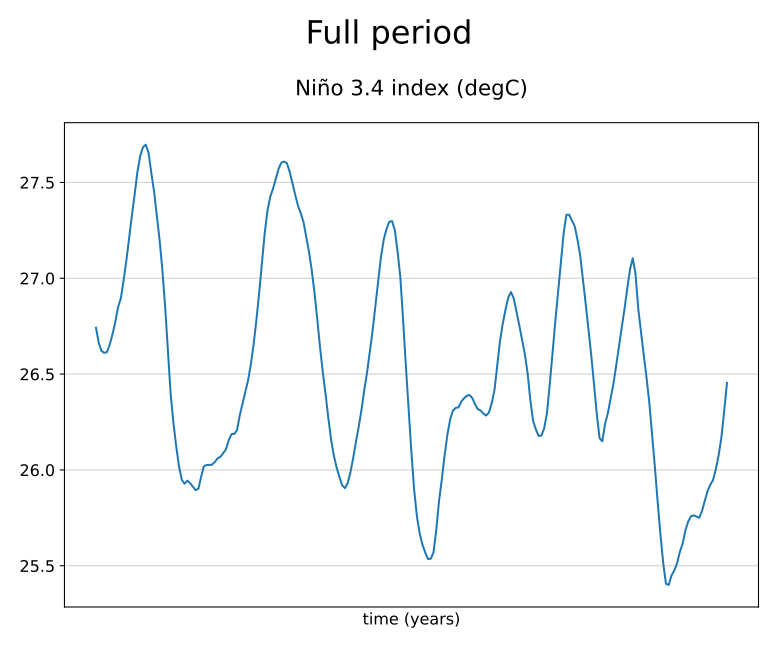
Timeseries of Niño 3.4 index, computed directly with the preprocessor.
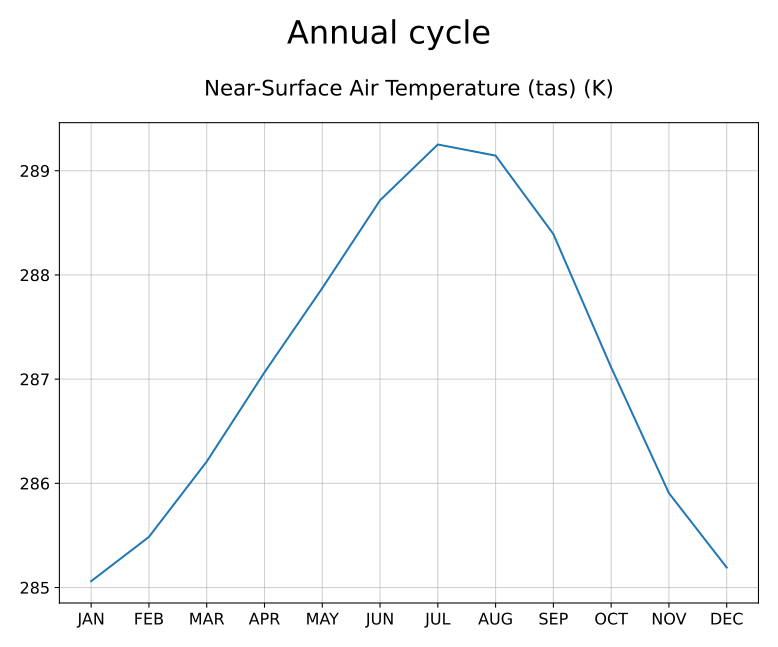
Annual cycle of tas.