Example recipes
Overview
These are example recipes calling example diagnostic scripts.
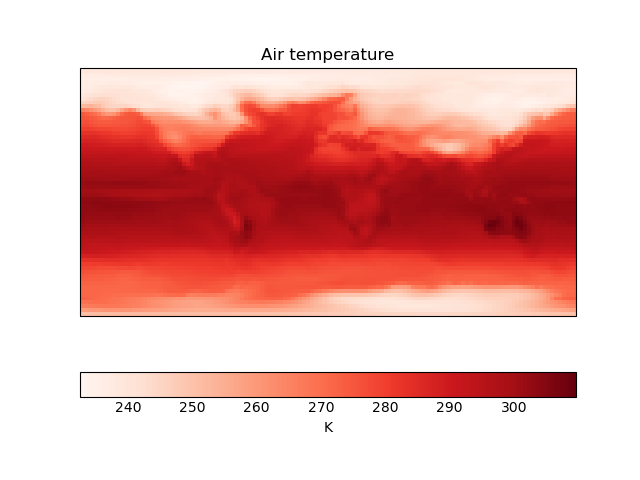
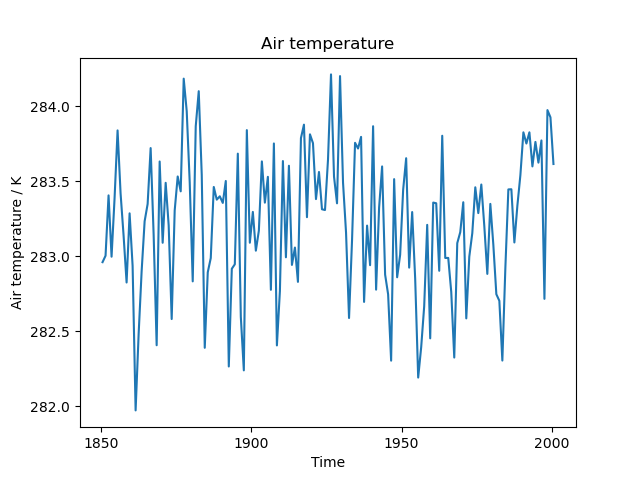
The recipe examples/recipe_python.yml produces time series plots of global mean temperature and for the temperature in Amsterdam. It also produces a map of global temperature in January 2020.
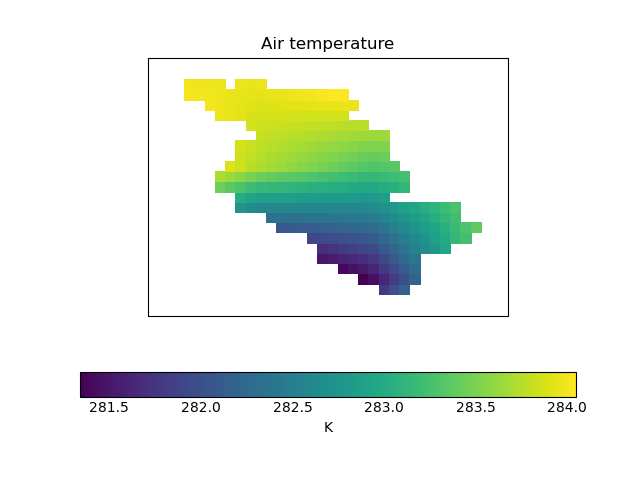
The recipe examples/recipe_extract_shape.yml produces a map of the mean temperature in the Elbe catchment over the years 2000 to 2002. Some example shapefiles for use with this recipe are available here, make sure to download all files with the same name but different extensions.
For detailed instructions on obtaining input data, please refer to Obtaining input data. However, in case you just quickly want to run through the example, you can use the following links to obtain the data from ESGF:
Available recipes and diagnostics
Recipes are stored in esmvaltool/recipes/
examples/recipe_python.yml
examples/recipe_extract_shape.yml
Diagnostics are stored in esmvaltool/diag_scripts/
examples/diagnostic.py: visualize results and store provenance information
User settings in recipe
Script
examples/diagnostic.pyRequired settings for script
quickplot: plot_type: which of Iris’ quickplot functions to use. Arguments that are accepted by these functions can also be specified here, e.g.cmap. Preprocessors need to be configured such that the resulting data matches the plot type, e.g. a timeseries or a map.
Variables
tas (atmos, monthly, longitude, latitude, time)